Debaters Behaving Badly, Part 1 - Cherry Picking Short-Term Trends
I've witnessed many debates about climate change recently in which debaters behave badly. In fairness to at least some of these debaters, many don't realize they're behaving badly. They received information they trust on blogs and YouTube videos, and they use this information in a discussions with others. But these bad tactics are still bad behavior even if we don't know it. So I thought it would be helpful to write a series on the dishonest tactics I see used in debate contexts that reflect bad behavior (either by the debater or his/her source). I'll begin with a tactic I've seen quite commonly recently - cherry picking short-term trends.
This tactic is frequently used by debaters attempting to show that global warming has "paused" or that Arctic sea ice is no longer decreasing. In the interest of brevity, I'll focus on the claim that there has been a "pause" in global warming. As we'll see, this is a faux pause claim (I'll be here all week...).
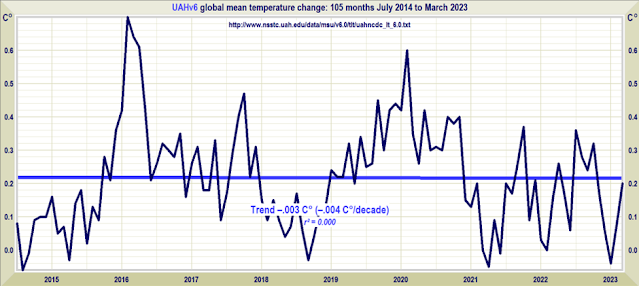
So if you check up on this, you find that indeed the best fit line through the UAH satellite data from July 2014 to March 2023 has a trend of -0.004 ± 0.471 °C/decade (2σ), just like he said. Almost.

But Monckton left off an essential part of the statistic. The trend is -0.004 ± 0.471 °C/decade (2σ). The last part of this statistic is the confidence interval (CI). The confidence interval, simply stated, tells you how much confidence you can have in the trend and the range of possible values for the trend (graphically represented in the blue curves in the above graph). It turns out that we can have about 95% confidence that the true trend for global lower troposphere temperatures is between -0.475 °C/decade and 0.467 °C/decade, and so warming could be continuing. In other words, it's dishonest to claim that there is a "pause" at all, let alone that it's lasted for 8 years, 9 months. Here's why.
 ENSO is climate-neutral. Given enough time, the effects of ENSO average out, and 30-years is a good length of time to average out the short-term effects of internal variability and ENSO to get at a climate trend. If we use a minimum climate trend of 30 years with UAH data, we get a statistically significant warming trend of 0.128 ± 0.084 °C/decade (2σ). In other words, on time scales relevant to climate, we can have confidence that climate is warming.
And UAH is a bit of an outlier. Another satellite dataset (RSS) calculates 0.218 ± 0.088 °C/decade (2σ) for the last 30 years for the lower troposphere. Datasets measuring global mean surface temperature also show more warming over the last 30 years. Berkeley Earth calculates 0.213 ± 0.050 °C/decade (2σ) and NASA calculates 0.220 ±0.060 °C/decade (2σ). On a climate-relevant time scales, statistically significant warming is found in all global datasets.
This is a clear example of debaters behaving badly. There is insufficient evidence to conclude that there's a pause of any length, and observations continue to be consistent with a global warming trend of 0.2 C/decade despite the objections of bloggers on Watts Up With That.
Has Global Warming Paused?
Periodically on the Watts Up With That blog, Christopher Monckton of Brenchley posts an update on how long he claims the current "pause" has lasted. As of the end of March 2023, he tells us that it has lengthened to 8 years 9 months, from July 2014 to March 2023. Monckton calculated the trend as -0.004 °C/decade.
So if you check up on this, you find that indeed the best fit line through the UAH satellite data from July 2014 to March 2023 has a trend of -0.004 ± 0.471 °C/decade (2σ), just like he said. Almost.
But Monckton left off an essential part of the statistic. The trend is -0.004 ± 0.471 °C/decade (2σ). The last part of this statistic is the confidence interval (CI). The confidence interval, simply stated, tells you how much confidence you can have in the trend and the range of possible values for the trend (graphically represented in the blue curves in the above graph). It turns out that we can have about 95% confidence that the true trend for global lower troposphere temperatures is between -0.475 °C/decade and 0.467 °C/decade, and so warming could be continuing. In other words, it's dishonest to claim that there is a "pause" at all, let alone that it's lasted for 8 years, 9 months. Here's why.
Statistical Significance
The true mean value (or the trend in mean values) of any complex population, like the temperature of the global troposphere, is unknown. Statistics is built on the idea that we can collect a representative sample, calculate the mean of the sample and then make inferences from the sample mean about the true, population mean. If a sample is not representative of the population - that is, if there are systematic biases in the sample - then the mean of the sample will not represent the mean of the population. But even if the sample represents the population with no systematic biases, there is still random error in the estimate, and so there's an uncertainty associated with every sample mean. So for any calculated trend in the sample (UAH data), there is a range of possible trends for the population (global lower tropospheric temperatures). The confidence interval tells us how accurate and precise the estimated trend is. In the statistics of CIs, the 2σ part means that the true value of the population's trend will fall within the confidence interval of the sample estimate in 19 out of 20 (95%) of representative samples. So we can have 95% confidence that the true trend of the global tropospheric temperatures is within -0.475 °C/decade and 0.467 °C/decade for the last 8 years and 9 months, assuming the UAH sample isn't contaminated by biases (and it is).
Any time the 95% confidence interval overlaps 0 (the CI is larger than the trend), the trend is not considered statistically significant. In effect, this is a hypothesis test. If you're attempting to determine if there's a pause in global warming, your null hypothesis is that warming is continuing. A trend of -0.004 ± 0.471 °C/decade means that you cannot reject the null hypothesis, since the trend with CI is consistent with warming. The evidence from this data is inconclusive - there simply is not enough data in the sample to reliably exclude the null hypothesis and conclude that there is a pause. For that to occur, you need statistical significance - you'd need a cooling trend that is greater than the confidence interval to rule out the possibility of continued warming of global tropospheric temperatures to 95% confidence.
The confidence interval of a calculated trend is essentially an assessment of how wiggly the data is. The more wiggly the data is, the greater the range of trend lines can reasonably fit within the available data. So the size of the CI relative to the trend can be affected by numerous factors:
- More variability in the data (larger departures from the mean) increase the CI - a greater range of trendlines may fit the data.
- More data decreases the CI - a smaller range of trendlines fit through the data the more data you add.
- The steepness of the slope. The larger the slope, the larger the CI can be without overlapping 0.
Climate Relevance
But let's grant, for the sake of argument, that a trend with a flat slope is real. What relevance would this have to climate science? Would we be able to conclude from this that global warming has at least temporarily stopped? Can we say that greenhouse gases no longer slow down the escape of IR light into space? Absolutely not. By convention, climate scientists use 30 years as a minimum time frame for temperature trends. This is a rule of thumb, but 30 years is a good minimum length of time to allow natural variability to average out so that the true climate signal can be seen.
Global temperatures are affected by many sources of internal variability - any one year may be warmer or cooler than the year before it. One of the most significant sources of natural variability is the ENSO cycle. El Niño years average warmer than La Niña years. ENSO introduces significant variability on the climate trend (which is ~0.2 C/decade). Because of the magnitude of the effects of ENSO operating on the climate trend, it's almost always possible to find short-term time frames where the slope of the temperature appears to flatten for a few years. To illustrate this, consider the graph below with hypothetical data. I constructed a straight-line "climate" trend of 0.2 C/decade. Then I added a sin curve to represent ENSO and some random noise for internal variability. The resulting graph looks similar to the warming in actual global temperatures for the last several decades, but there are several short-term time periods in which the slope appears to flatten a bit, even thought the long-term "climate" trend is unwavering at 0.2 C/decade.
 |
| Hypothetical Warming Trend with Natural Variability |
And you can see the same dynamic in actual GMST data. As you can see in the chart below, El Niño years, La Niña years, and neutral years are all warming at about the same rate. They are all equally affected by the long-term climate trend caused by AGW.
 |
| UAHv6 |
And UAH is a bit of an outlier. Another satellite dataset (RSS) calculates 0.218 ± 0.088 °C/decade (2σ) for the last 30 years for the lower troposphere. Datasets measuring global mean surface temperature also show more warming over the last 30 years. Berkeley Earth calculates 0.213 ± 0.050 °C/decade (2σ) and NASA calculates 0.220 ±0.060 °C/decade (2σ). On a climate-relevant time scales, statistically significant warming is found in all global datasets.
 |
| Berkeley Earth |
Conclusion
So what is Monckton doing when he speaks of the "continuing failure of global temperatures to do as they are told?" He's cherry picking. Cherry picking is the practice of carefully selecting a sample that will produce a mean (or a trend) that provides desired results but disagrees with the whole. The practice of cherry picking short-term trends to make faux pause claims is so common that it's actually the example of cherry picking shown in its Wikipedia entry. And Monckton both denies and then immediately admits that's exactly what he's doing: "The start and end dates of the New Pause are not cherry-picked. The end date is the present; the start date is the farthest back one can reach and still find a zero trend." Did you catch that? He's saying he's not cherry picking - he's just carefully selecting a start date that produces his desired "pause," even though the trend is statistically insignificant and too short to be relevant to climate anyway. If you look at all the relevant data, you can clearly see that warming is continuing and claims of "pauses" are based entirely on cherry picking statistically-insignificant, short-term trends..
| The Escalator of Global Warming |
If you're in a position either to make a claim about global temperatures or to respond to someone else making a claim, and you need to know the confidence interval, let me suggest you use a free tool on the web, a trend calculator hosted by skeptical science. For many datasets, this will allow you to see precisely what the confidence interval is, so you can make sure you're not behaving badly and also check to see if the person you're debating is behaving badly. And if someone could let Christopher Monckton know about this too, that would be great.
In part 2 of this series, I consider the trick of dishonest use of scales to hide the incline of global temperatures.
Comments
Post a Comment