Posts

Showing posts with the label correlation

Correlation Between CO2 and Temperature on Various Time Scales

Image
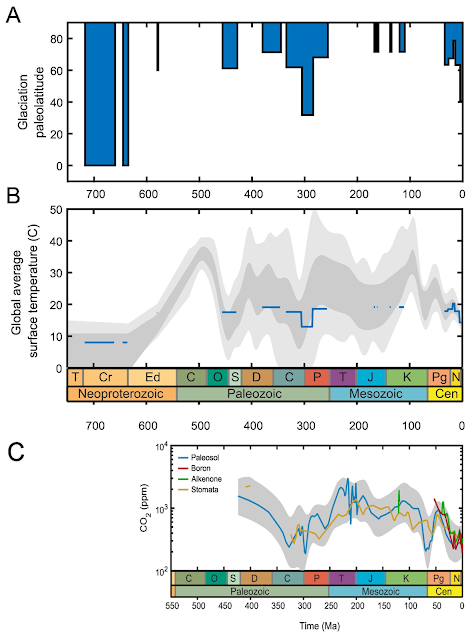
Note: 1/15/2024. Graphs are updated to include 2024 when available. You sometimes hear that, at least on certain time scales, CO2 and global temperature (GMST) don't correlate very well or even that the two go in opposite directions. The implication drawn from this is that CO2 can't be the primary driver of climate changes. What I want to show here is that this claim is categorically false. On virtually all time scales in the Phanerozoic, CO2 and GMST correlate very well, especially when taking into consideration that GMST correlates with the log of CO2.  The best way for me to demonstrate this point is to simply show the correlation. Where I can, I convert CO2 to forcings (using RF = 5.35*ln(CO2/280)) and and plot CO2 forcings on the x-axis and GMST on the y-axis. This gives us two advantages: first, it allows us to calculate the r^2 for that correlation, and second, the slope of the correlation gives us an indication of sensitivity - that is, the temperature response to chang...

Responding to the CO2 Coalition's "Fact #27" on Post WWII Temperatures

Image
CO2 Coalition 's " Fact #27 " depends almost entirely on cherry picking. Here we're told that for 33 years, global temperatures cooled while CO2 emissions increased. "We have seen that the beginning of the modern increase in CO2 emissions began in the post-WW II industrial boom. Yet that great rise in CO2 was accompanied by a significant 33-year span of global cooling from 1944–1976. If CO2 is the primary driver of modern temperature change, why did temperatures actually fall during this time span?" Here's the graph they posted. I'll answer their question after clarifying the issues here. The graph above contains numerous problems. First, they posted monthly temperature anomalies from HadCRUT4 (which is out of date) and annual emission CO2 emission values for 1944-1976. The decision compare monthly temperatures to annual emissions appears to be an attempt to exaggerate the differences between the two. CO2 Coalition should have used annual values for ...

Are We Still Coming Out of the Little Ice Age?

Image
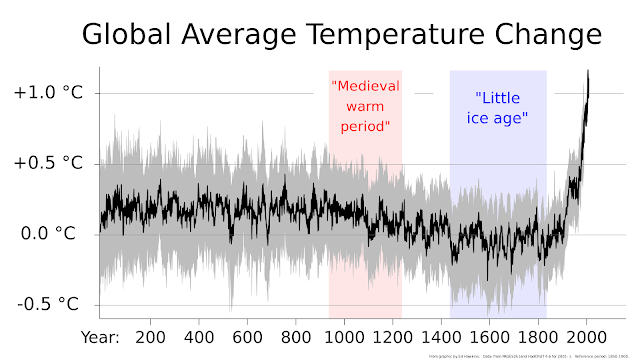
Once common refrain I hear among contrarians is that current warming shouldn't be considered exceptional or caused human activity because we're just "coming out of the Little Ice Age." The problem with this can be seen immediately by looking at the Pages2K reconstruction of global temperatures. There was likely a cooling of global temperatures that led to the LIA, normally thought to be from 1450-1850. All treatments of the LIA that I'm aware of place the end of the LIA at or near 1850. So since 1850 it's more accurate to say that we came out of the LIA in ~1850, not that we're coming out of the LIA in 2024. Beyond this, the years between 1850 and 1900 were essentially flat. I calculated the trend with uncertainty for the three GMST datasets for 1850-1900: HadCRUT5:           -0.012 ± 0.023°C/decade (2σ) Berkeley Earth:     0.011 ± 0.028°C/decade (2σ) NOAA:                      -0.006 ± 0...

Debaters Behaving Badly, Part 2 - Using Scales to Hide the Incline

Image
In  Part 1  of this series on debaters behaving badly, we saw how some debaters behave badly by misusing short-term trends to claim that global warming has paused, leading to the proliferation of what I consider faux pause claims on the internet and social media. Here in Part 2, I'd like to consider the next most popular tactic I see used frequently in climate debates - using dishonest scales to make false claims about global temperatures or the correlation between temperatures and carbon dioxide. Misusing Scale to "Hide the Incline" of Global Temperatures One of the largest repositories of bad debate behavior on the internet is on the Watts Up With That blog. Anthony Watts recently wrote a post complaining about accurate reporting of global temperature anomalies and decided to replace them with his substitute version , which you can find on a side bar of his blog whenever you visit. It looks like this: To do this, Watts replaced the baseline temperature value of the G...

Comparing CO2 Forcings and Temperature in the Geologic Past

Image
For over 20 years, geologists have attempted to model CO2 concentrations across the geologic past. Geologists currently have sufficient proxy evidence to reconstruct CO2 concentrations for significant parts of the last 420 million years, but models can be useful to infer concentrations when proxy evidence is weaker or lacks sufficient resolution. While "box" models like COSPE or GEOCARBSULF  confirm broad correlations between CO2 and global temperatures , the correlation may be improved if the models take better account of tectonic processes affecting CO2 concentrations. Evaluation of Proxies for CO2 and Temperatures In a study published three years ago, Mills et al 2019 evaluated the performance of CO2 proxies as well as COPSE and GEOCARBSULF "box" models for CO2. The latter model is the most recent update to the GEOCARB model that is frequently misused in contrarian graphs of CO2 and temperature - GEOCARBIII was published in Berner 2001 and is often plotted wit...