Posts

Showing posts with the label anomaly

2023 Global Mean Surface Temperatures

Image
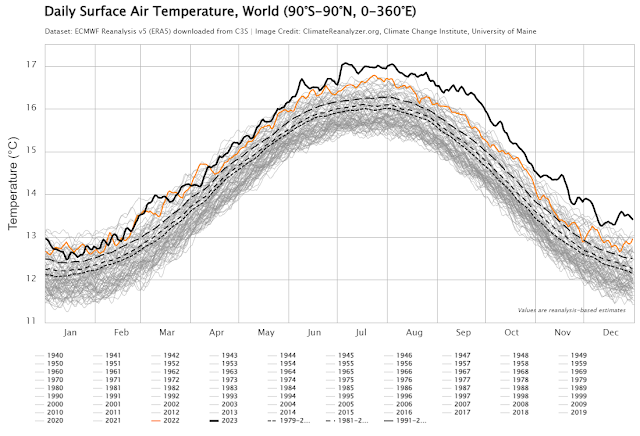
Most of the GMST temperature data is in for 2023, and it was a doozy. Around June 1, GMST headed into unchartered territory, and they stayed there for the rest of the year, with only a few days not record temperatures for the instrumental record. Now with the the availability of daily reanalysis data, it's been possible to track this on a near daily basis.  ClimateReanalyzer data for 2023 from ERA5 At the end of 2022, even with the likelihood that El Niño conditions would develop, most thought that there would be a low probability that 2023 would be a record year, beating 2016/2020, as you can see from this graph by Zeke Hausfather. 2023 came in significantly warmer than the range expected at the beginning of the year. When large El Niños developed in 1997 and 2015, it was the following year that became record years, and there's good reason to think this pattern would continue, though since scientists don't know exactly why 2023 was so warm, we should perhaps take that expe...

Why are Global Temperatures Reported as Anomalies?

Image
For over 100 years, scientists investigating climate change have estimated that the Earth's surface temperature is ~288 K (or ~15°C), which is about 33 K warmer than the Earth's effective temperature of ~255 K (or -18°C). The first paper I know of to use ~15°C as the Earth's "current" temperature is Svante Arrhenius' paper .[1] I've read reports that Fourier did as well but I haven't been able to find where he actually uses this figure. The figure of ~15°C has become somewhat standardized in explanations of the greenhouse effect, with various authors continuing to use the same figure of ~15°C, even as global temperatures rise. Since the sources using this figure are not basing the value on global measurements, I suspect it's best to view it has having an uncertainty of at least ±1°C. Can we do better? Accuracy of Anomalies vs Absolute Temperatures More recently, organizations like NASA have estimated that GMST for their 1951-1980 baseline averaged ...

When Will We Cross IPCC Targets?

Image
Recently NOAA released v. 5.1 of their global GMST dataset and, aside from adding full global coverage, it extended the dataset back to 1850. This gives us a third GMST dataset that goes back to 1850. Since the IPCC uses the 1850-1900 mean as a baseline to represent "preindustrial" temperatures, this gives us three datasets to use to calculate the amount of warming we've experienced above preindustrial levels. The IPCC has set a target of +1.5°C above preindustrial temperatures, where +1.5°C is a 30-year average above the 1850-1900 mean. The IPCC estimates that 2011-2020 averaged +1.1°C above preindustrial levels. But the question I have is, where are we now, and when will we cross the +1.5°C and +2.0°C targets if we continue warming at current rates? To answer this question, I took the data I've already downloaded from NOAA (monthly), HadCRUT5 (monthly) and Berkeley Earth (annual). The NOAA dataset is current through January 2023 and the other two are current through...