Posts

Showing posts with the label hansen

How Well Has Hansen's 1988 Climate Model Performed?

Image
We hear a lot that climate models predict too much warming of global mean surface temperature (GMST), but just about every graph intended to back this up contains flaws or misrepresentations, either by sloppy comparisons of models vs observations or using a subset of models that are heavily influenced by those with high sensitivities. I think it's valuable to show how well models form, since the sensitivities of those that perform the best are likely to be good indicators of the sensitivity of the real climate system. So I thought I'd toss my hat in the ring by comparing Hansen's 1988 climate model with observations. This has been done before, most notably by Zeke Hausfather in 2019, but it's been 6 years since then, and I thought it might be good to update it. To do this, I downloaded Hansen's data for GHG forcings and temperatures for his Scenarios A, B and C (available here and here ), and I plotted these scenarios with the major GMST datasets against their 1958...

What Exxon Knew in 1982

Image
If you've participated in discussion about climate change, you've probably come across the slogan "Exxon Knew." This came out as private, internal communications from within Exxon (and other fossil fuel companies) revealed that their scientists had been investigating potential catastrophic consequences of fossil fuel emissions, and they made predictions that turned out to be pretty accurate. To what extent Exxon is culpable for this is difficult to determine. However, what is clear (to me) is that Exxon and other fossil fuel companies ought to be held liable for knowingly promoting misinformation when their own scientists were telling them that there were valid concerns that continued fossil fuel emissions would have harmful consequences for humanity. Papers were published in 2021[1] and 2023[2] that evaluated the accuracy of the scientific work that Exxon knew by evaluating the internal studies that have now been made public. The above graph has been popularly shared...

Climate Bibliography, Part 1 - The Early Years (1824 - 1988)

Image
I thought it would be beneficial to produce an annotated bibliography of important scientific works in the field of climate science. Obviously I can't make this list exhaustive, but I'm planning to generate several bibliographies, mostly on specific topics in climate science that interest me, and I plan to periodically modify them as new papers are written (or as I discover papers written in the past). I thought it best to cover the early years of climate science as a historical survey. My first post will cover 164 years of  climate science from Fourier in 1824 to Hansen in 1988.

Debaters Behaving Badly, Part 5 - Dishonest Quotations

Image
If you participate in debates on climate science, how often have you been told that Al Gore predicted that the North polar ice cap would be gone by 2013? How often have you been given quotes from Edenhofer "proving" that AGW is a political hoax from a socialist agenda to redistribute global wealth? These kinds of claims are everywhere in these debates, but frequently when we investigate these seemingly outlandish quotes, they turn out to be fabrications - contortions of what was actually said. In other words, they appear to be blatant dishonesty and personal attacks on the part of people who generate the fake quotes.  To be clear, not everyone using these fake/contorted quotes know that they are fake or contorted. People frequently share and promote things without checking on their accuracy, so I thought I'd collect a few of the more prominent fake quotes here. I may add to this as time goes by, but I'll begin with these four that I think are both extremely common and...

Hansen on Global Warming in the Pipeline

Image
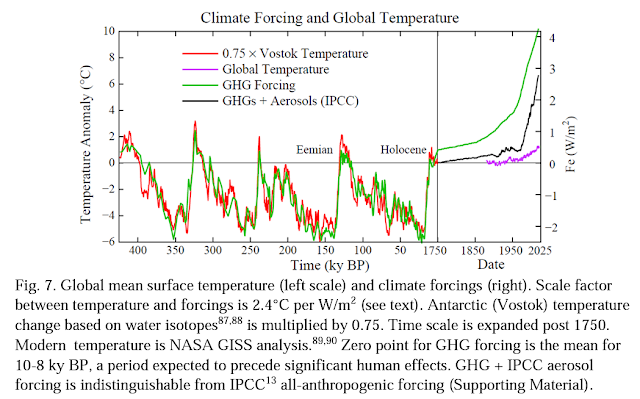
A paper is currently sitting on the ArXiv[1] awaiting publication that has garnered a fair amount of attention on social media. It's a paper by Hansen with several other well-respected and influential scientists. Since this paper is currently in prepublication, and I don't know what this paper will be like when it's published, I don't want to make too much of this, but it is very interesting, if alarming. At best, I see this as an upper bound estimate of how bad AGW could become long-term. I'd like to consider what this paper (in it's current form) is suggesting and evaluate what it claims. Summary of Hansen's Paper The general thrust of this paper is that paleoclimate evidence shows that fast feedback sensitivity (ECS) is 3.5 - 5.5°C and GHG forcings are are 4.1 W/m^2. After slow feedbacks bring the Earth's climate system into full equilibrium with these forcings (what is called Earth System Sensitivity), we can expect about 7-10°C warming long term fro...

Trends in the Earth's Energy Imbalance

Image
  A study was published last year that used two independent methods to estimate the rate at which the Earth's Energy Imbalance is increasing between mid-2005 and mid-2019. The first method used in situ measurements to calculate the planetary heat uptake. This method found the trend for 0–2,000 m ocean heat content anomaly to be 0.43 ± 0.40 W/m^2/decade. The second method used satellite measurements to calculate a CERES TOA energy flux of 0.50 ± 0.47 W/m^2/decade. These two trends were statistically identical to each other - the difference between them was 0.068 ± 0.29 W/m^2/decade.  The average value for EEI for the entire study period was 0.77 ± 0.06 W/m^2. In a previous post , I used three different estimates for EEI, this paper, one from Hansen (2005-2010) and one from von Schuckmann (2011-2018). I plotted all three of these values in the center year for the estimate in yellow as "studies."  In the above graph, I plotted the values for CERES and in situ measurements as...

Estimating TCR and ECS from the Logarithmic Relationship Between CO2 and GMST

Image
In a previous post , I calculated ECS (accounting for increases in GHGs and aerosols) to be about 3.3 C.  The calculation was based on CO2 causing 2.11 W/m^2 increase in radiative forcing with a total increase, after accounting for GHGs other than CO2 and aerosols, of 2.17 W/m^2 (aerosols cancel out most of the effects of GHGs outside of CO2). One weakness of that approach is that it used a value for EEI that was an average for 2011-2018 with forcings that were current through 2020. I've been thinking about a way to improve this, and here's what I came up with. Transient Climate Response (TCR) Since the relationship between CO2 and temperature is logarithmic, I decided to plot the relationship between temperature and ln(rCO2) to see what that might be able to tell us about sensitivity from empirical data. So in the above graph, on the y-axis I plotted GMST from HadCRUT5 using a 1850-1900 baseline to match the IPCC's approximation of preindustrial levels. On the x-axis, I pl...