Posts

Showing posts with the label EEI

A New Paper Makes Low Sensitivity Models More Implausible

Image
A paper was published this week that argues that low-sensitivity models do a poor job of reproducing CERES-derived EEI trends. In the words of the paper, the authors used CMIP6 models "to illustrate that low climate sensitivity models have an EEI trend behavior that is inconsistent with the satellite-derived EEI trend." Even though models with an ECS near 3°C do a good job of reproducing current warming, CMIP6 models often differ in the in EEI trends. For instance, The CERES data show a stronger trend in EEI than the multi-model CMIP6 mean and higher EEI in 2023 than any of the CMIP6 models. However, for individual CMIP6 models and ensembles, EEI is comparable to or higher at other periods than the CERES value in 2023. The difference in trends can be seen by comparing the red CERES line to the black CMIP6 model mean. Even though the interannual variability in the CMIP6 models is consistent CERES observations, the observed trend in EEI, especially since about 2010, is higher t...

Can Changes in Cloud Cover Drive Global Warming?

Image
Ned Nikolov and Karl Zeller have published a new paper (NZ24) in the quasi-predatory MDPI journal geomatics [1] which claims to rule out the effects of greenhouse gases as a cause for the increase in GMST in recent decades. Their paper concludes, Our analysis revealed that the observed decrease of planetary albedo along with reported variations of the Total Solar Irradiance (TSI) explain 100% of the global warming trend and 83% of the GSAT interannual variability as documented by six satellite- and ground-based monitoring systems over the past 24 years. Changes in Earth’s cloud albedo emerged as the dominant driver of GSAT, while TSI only played a marginal role. They produce a graph that they believe supports their claim, which sure enough shows a decrease in the Earth's albedo over the last 24 years and a corresponding increase in absorbed solar radiation (ASR). Let me be clear here at the beginning that there absolutely has been both a decrease in albedo and a corresponding in c...

Updated Calculation for ECS and TCR

Image
Every year I try to think of a way to update my simple calculations for ECS and TCR. My methods don't really change that much; they reflect updated data and become a little more complex. Make no mistake, they are simple calculations based on estimates of forcings, temperature and EEI using the energy balance equation. It doesn't compete with peer-reviewed studies by Sherwood[1] or the assessments of the IPCC. My intent with this is to show that the central estimates of the IPCC (and most climate models) are very consistent with empirical data.   The first step in the calculating ECS and TCR values is assessing the earth's energy imbalance and collecting the relevant forcing data. Earth's Energy Imbalance There are several estimates for EEI to choose from, but I think the most conservative approach is to use an average value for the full time frame between 2005 and 2019, when observations become much  more reliable. One study, Loeb et al 2021[2] estimated EEI to be 0.77 ...

Trends in the Earth's Energy Imbalance

Image
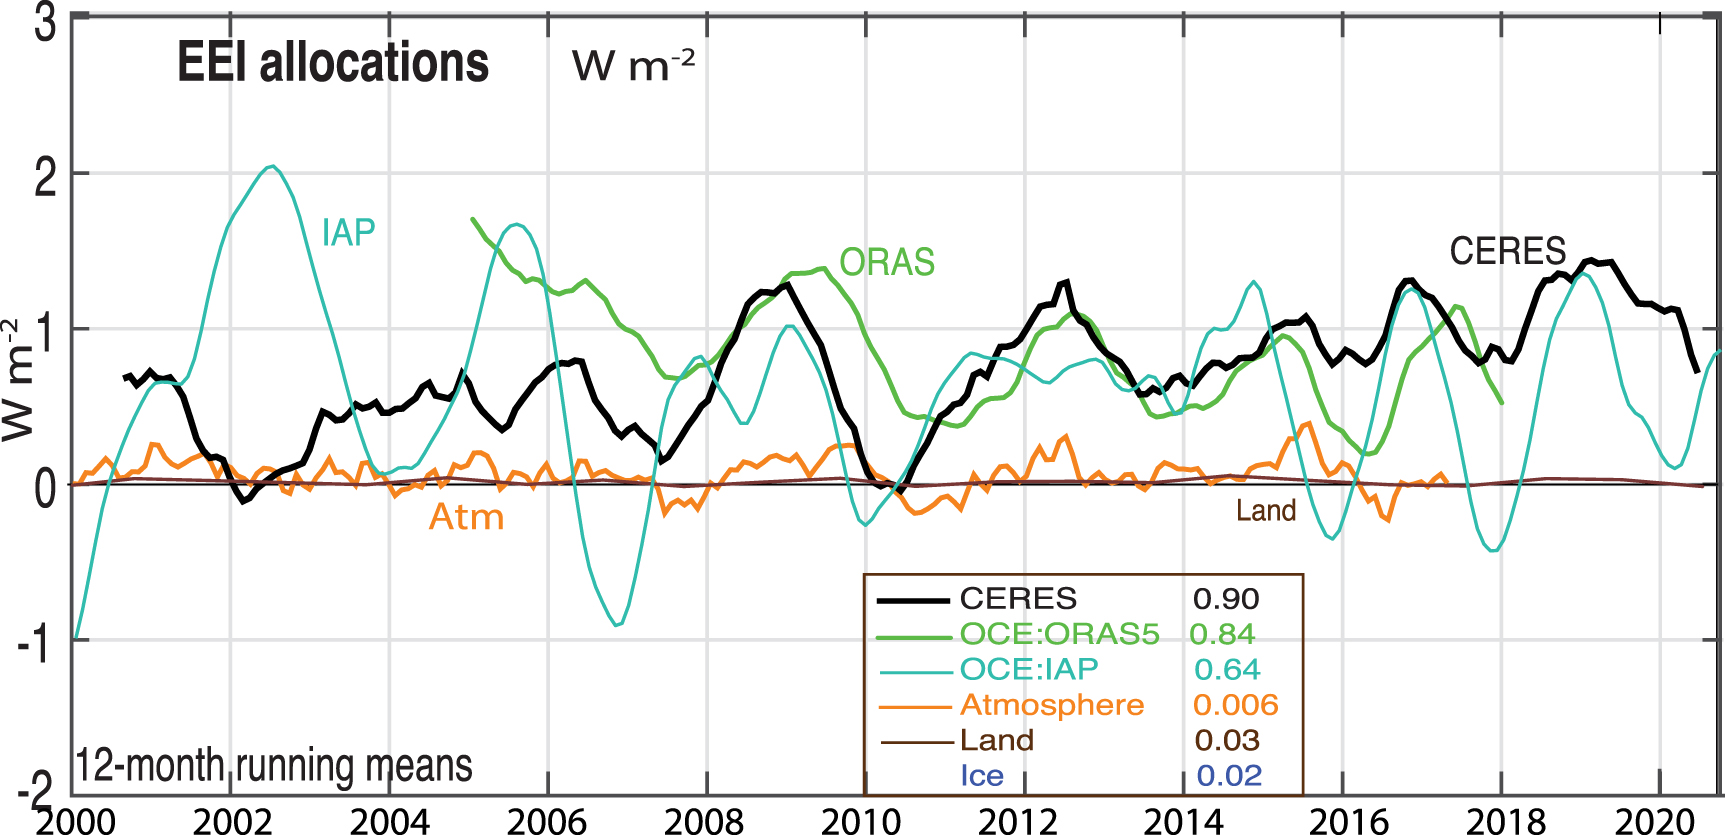
  A study was published last year that used two independent methods to estimate the rate at which the Earth's Energy Imbalance is increasing between mid-2005 and mid-2019. The first method used in situ measurements to calculate the planetary heat uptake. This method found the trend for 0–2,000 m ocean heat content anomaly to be 0.43 ± 0.40 W/m^2/decade. The second method used satellite measurements to calculate a CERES TOA energy flux of 0.50 ± 0.47 W/m^2/decade. These two trends were statistically identical to each other - the difference between them was 0.068 ± 0.29 W/m^2/decade.  The average value for EEI for the entire study period was 0.77 ± 0.06 W/m^2. In a previous post , I used three different estimates for EEI, this paper, one from Hansen (2005-2010) and one from von Schuckmann (2011-2018). I plotted all three of these values in the center year for the estimate in yellow as "studies."  In the above graph, I plotted the values for CERES and in situ measurements as...

Estimating TCR and ECS from the Logarithmic Relationship Between CO2 and GMST

Image
In a previous post , I calculated ECS (accounting for increases in GHGs and aerosols) to be about 3.3 C.  The calculation was based on CO2 causing 2.11 W/m^2 increase in radiative forcing with a total increase, after accounting for GHGs other than CO2 and aerosols, of 2.17 W/m^2 (aerosols cancel out most of the effects of GHGs outside of CO2). One weakness of that approach is that it used a value for EEI that was an average for 2011-2018 with forcings that were current through 2020. I've been thinking about a way to improve this, and here's what I came up with. Transient Climate Response (TCR) Since the relationship between CO2 and temperature is logarithmic, I decided to plot the relationship between temperature and ln(rCO2) to see what that might be able to tell us about sensitivity from empirical data. So in the above graph, on the y-axis I plotted GMST from HadCRUT5 using a 1850-1900 baseline to match the IPCC's approximation of preindustrial levels. On the x-axis, I pl...

A Calculation for Equilibrium Climate Sensitivity (ECS)

Image
Tree Overhanging the Econ River, Little Big Econ State Forest, May 9, 2021 My interest in "wood romances" spans the gamut from nature photography to hiking, to conservation, to understanding the future impacts of climate change. I frequently participate in on-line discussions on these matters, and many of the same issues get recycled in numerous contexts. I've taken to addressing these in relatively short responses so that I don't have to rewrite the same arguments, evidence and calculations. Here is a basic calculation of equilibrium sensitivity (ECS) that I did recently. ECS is the amount of increase in global mean surface temperature (GMST) after reaching equilibrium with a doubling of CO2 concentrations. There are many ways to do this, and this is a simple energy balance equation that uses empirical data for various forcings to arrive at the estimate. This of course is not the end of discussion on the matter. Many scientific studies have been written estimating t...