Posts

Showing posts with the label robert rohde

Initial Response to "A Critical Review of Impacts of Greenhouse Gas Emissions on the U.S. Climate"

Image
NCA5 Analysis of Historical and Future CONUS Warming (I'd like to show you the Climate Working Group version but there isn't one) In his 1974 commencement address delivered at Caltech, Richard Feynman warned against scientists "fooling themselves" by doing what superficially looks scientific, but lacks rigorous and critical analysis. In the South Seas there is a Cargo Cult of people. During the war they saw airplanes land with lots of good materials, and they want the same thing to happen now. So they’ve arranged to make things like runways, to put fires along the sides of the runways, to make a wooden hut for a man to sit in, with two wooden pieces on his head like headphones and bars of bamboo sticking out like antennas—he’s the controller—and they wait for the airplanes to land. They’re doing everything right. The form is perfect. It looks exactly the way it looked before. But it doesn’t work. No airplanes land. So I call these things Cargo Cult Science, ...
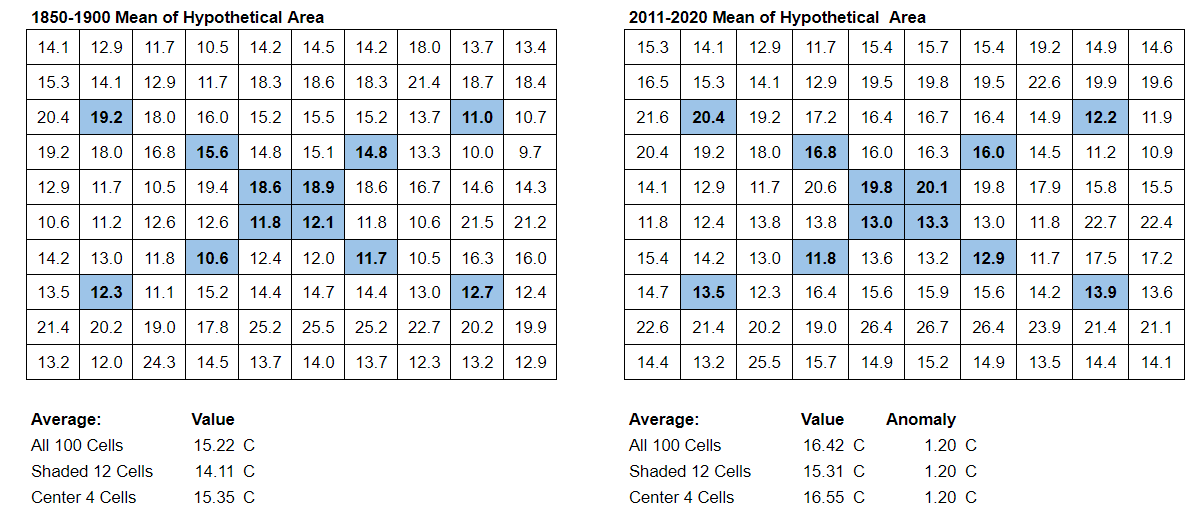
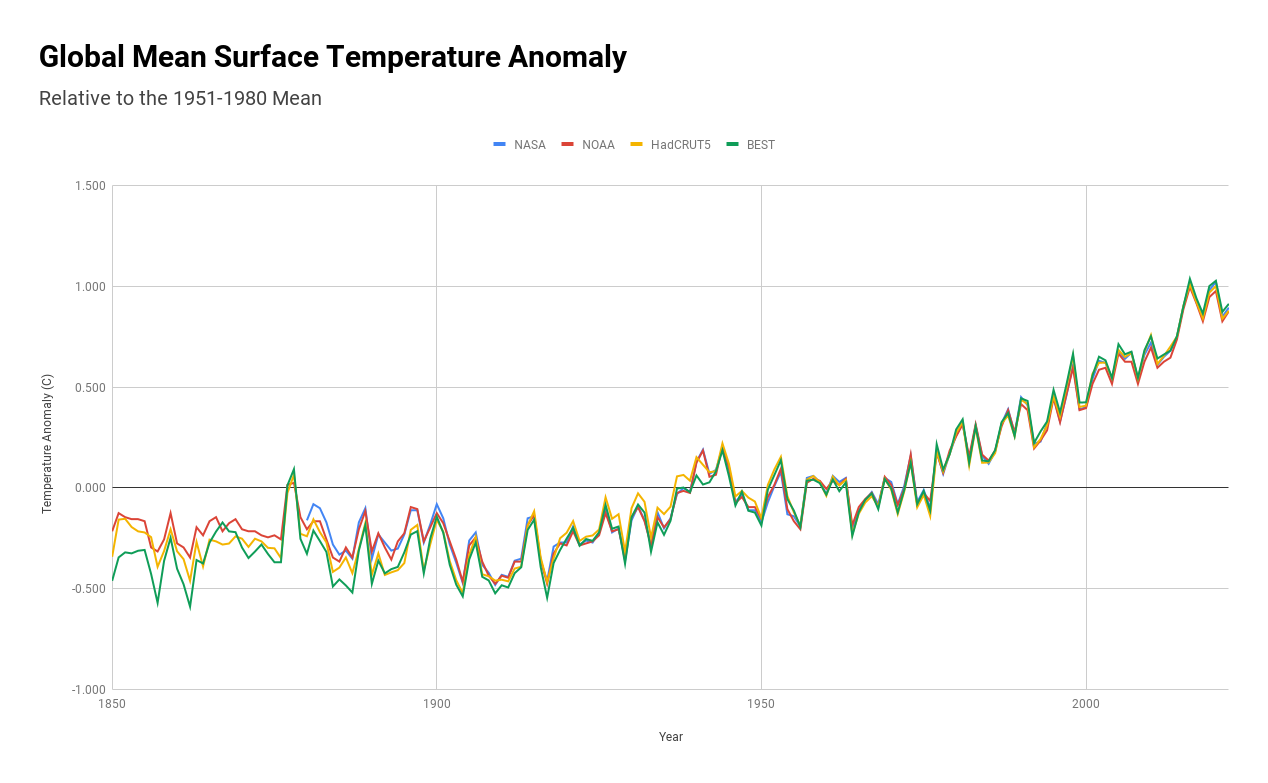
Why are Global Temperatures Reported as Anomalies?

Image
For over 100 years, scientists investigating climate change have estimated that the Earth's surface temperature is ~288 K (or ~15°C), which is about 33 K warmer than the Earth's effective temperature of ~255 K (or -18°C). The first paper I know of to use ~15°C as the Earth's "current" temperature is Svante Arrhenius' paper .[1] I've read reports that Fourier did as well but I haven't been able to find where he actually uses this figure. The figure of ~15°C has become somewhat standardized in explanations of the greenhouse effect, with various authors continuing to use the same figure of ~15°C, even as global temperatures rise. Since the sources using this figure are not basing the value on global measurements, I suspect it's best to view it has having an uncertainty of at least ±1°C. Can we do better? Accuracy of Anomalies vs Absolute Temperatures More recently, organizations like NASA have estimated that GMST for their 1951-1980 baseline averaged ...

Bias Correction in Surface Thermometer Datasets

Image
Virtually all temperature datasets that have been around for a significant amount of time depend on surface thermometers, most of which were not designed to measure climate changes; they were positioned to collect meteorological data for temperature and precipitation, and many of these stations have been maintained by volunteers. In earlier years there was no standardized process for even when temperatures were recorded. Daily temperatures were calculated using max-min thermometers that recorded the "max" and "min" temperatures recorded by the thermometer since the last time it was checked and reset. If the thermometer was checked daily, this would give data for daily highs and lows. The average temperature for the data as calculated simply by Tavg = (Tmax + Tmin)/2. Biases can easily enter into the temperature record by systematic changes in 1) time of observation , 2) instrument technology, and 3) urbanization, as well as other factors. Likewise, sea surface tempe...