Why are Global Temperatures Reported as Anomalies?
For over 100 years, scientists investigating climate change have estimated that the Earth's surface temperature is ~288 K (or ~15°C), which is about 33 K warmer than the Earth's effective temperature of ~255 K (or -18°C). The first paper I know of to use ~15°C as the Earth's "current" temperature is Svante Arrhenius' paper.[1] I've read reports that Fourier did as well but I haven't been able to find where he actually uses this figure. The figure of ~15°C has become somewhat standardized in explanations of the greenhouse effect, with various authors continuing to use the same figure of ~15°C, even as global temperatures rise. Since the sources using this figure are not basing the value on global measurements, I suspect it's best to view it has having an uncertainty of at least ±1°C. Can we do better?
Accuracy of Anomalies vs Absolute Temperatures
More recently, organizations like NASA have estimated that GMST for their 1951-1980 baseline averaged "14°C (57°F), with an uncertainty of several tenths of a degree." On another page, they quantify this uncertainty a little further to around 0.5°C. Combined with the same estimate for the Earth's effective temperature of about -18°C, and the greenhouse effect made the 1951-1980 mean about 32°C warmer than the Earth's effective temperature. However, if we only know the GMST to an accuracy of 14±0.5°C, and GMST has only increased by 1.2°C, how can we be certain about how much of this measurement is real and how much of it an artifact of GMST's uncertainty?
An important paper by Hansen and Lebedeff was published in 1987[2] that provides a solution to this problem. This paper examined station data from 1880-1985 an found that "temperature changes at mid- and high latitude stations separated by less than 1000 km are shown to be highly correlated; at low latitudes the correlation falls off more rapidly with distance for nearby stations." This is an important finding. Variability in absolute temperatures may be very large over a given area, requiring an impractical number of meteorological stations to calculate the absolute temperature of a region with a high degree of accuracy. But since temperature changes are highly correlated, that means scientists can have a great deal more confidence about how temperatures change in a given region. This allowed them to set up a grid making use of available station data to calculate anomalies with greater accuracy. Currently, NASA states[3] that "the most complete assessment ever of statistical uncertainty within the GISS Surface Temperature Analysis (GISTEMP) data product shows that the annual values are likely accurate to within 0.09 degrees Fahrenheit (0.05 degrees Celsius) in recent decades, and 0.27 degrees Fahrenheit (0.15 degrees C) at the beginning of the nearly 140-year record." In other words, using anomalies reduces the number of stations needed to determine how much global temperatures have changed. In fact, it reduces uncertainties by a factor of 10, and this gives us much more confidence that ~1.2°C warming above the 1850-1900 mean reflects what's actually happening at the Earth's surface and not a product of the uncertainties of our measurements.
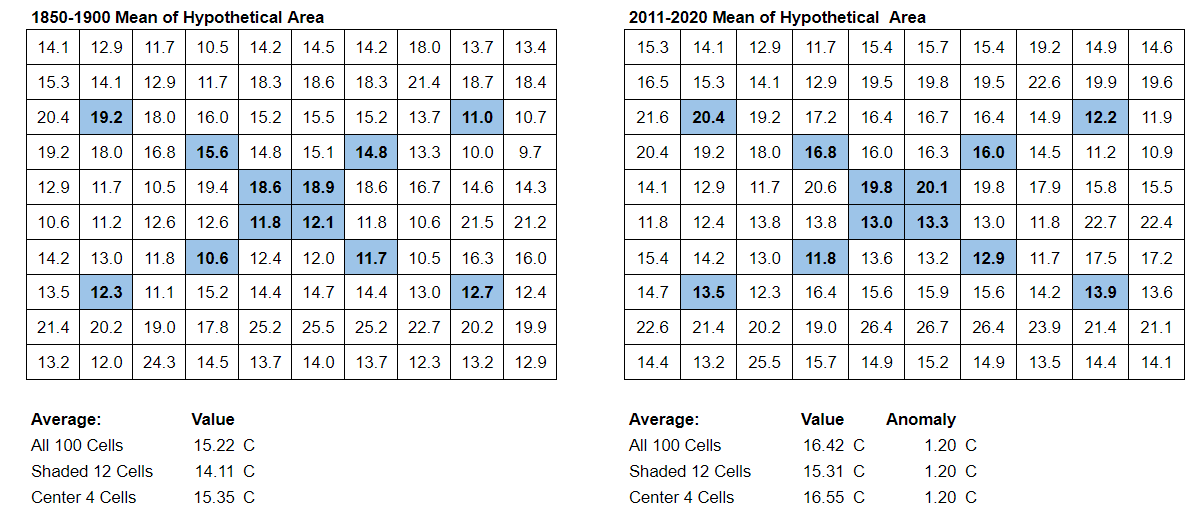
I thought it might be beneficial to illustrate this concept. Above I generated an idealized hypothetical area using a spreadsheet. Let's assume for the sake of argument that 100 stations would accurately measure the average absolute temperature of the area. However, if we only have 12 stations in that area or 4 stations in the area, the average absolute temperature of the smaller samples will be off by a significant amount. But if the changes in temperatures are highly correlated (in the above example they are exactly correlated), then the change in temperature can be calculated accurately with 12 or even 4 stations. The observation of Hansen and Lebedeff means that we can have a great deal more confidence about how much the Earth's surface is warming than we can have about its absolute temperature. And climate scientists are mostly concerned with how much and how rapidly the planet's surface is warming, so GMST dataset typically report temperatures in terms of anomalies.
There are other posts that have made similar points. One post made use of an online tool that allows you to see how much global temperature trends would change as you decrease the number of stations used. Provided that you decrease the number of stations randomly while maintaining geographical distribution of the stations, the trends don't change by much over ~120 years or so, in this example even down to 65 stations.
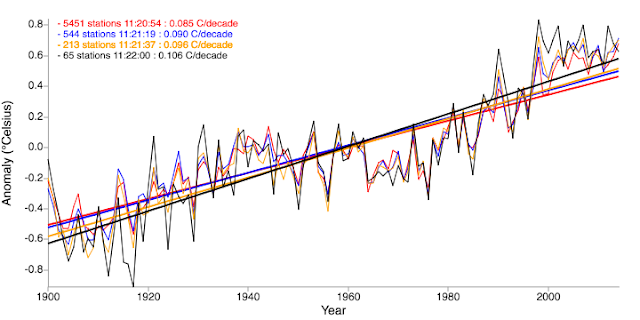
Kevin Cowtan offered a comment to this based on a paper[4] he had just written arguing that the actual minimum number of stations to achieve an accurate trend should be perhaps about twice as high, at ~130 stations. Cowtan argued for a minimum distance of ~800 km on the length scale (or an area with radius of ~1100 km) to determine the number of necessary stations to calculate accurate global warming trends. That is, an isolated station has an "information radius" of about 1100 km. A region of this size with one station can be weighted equally with an area of the same size with a large density of stations. This leads to a minimum number of ~130 stations. This of course assumes that these stations are ideally-situated, and there are still areas of the planet that do not have sufficient coverage (the largest of which is Antarctica). These areas with lack of coverage add to the uncertainty in the estimates for GMST anomalies and trends in global warming. But even with these uncertainties, scientists have more than enough stations to calculate global warming rates accurately and to be confident that global temperatures are now ~1.2°C warmer than the 1850-1900 mean.
 |
| Graph from Robert Rohde on X |
Seasonal Variability in Anomalies vs Absolute Temperatures


Both of these graphs contain useful information, but the latter graph puts the climate-related aspects of the data more front and center. Here we can more clearly see how each month's temperature compares to a 50 year baseline, and the slope of this graph corresponds to how rapidly GMST is warming, within its margin of error. If you're interested in whether it's meaningful to talk about global average temperature at all, see my previous post.
References:
[1] Svante Arrhenius. On the Influence of Carbonic Acid in the Air upon the Temperature of the Ground. Philosophical Magazine and Journal of Science Series 5, Volume 41, April 1896, pages 237-276.
[2] Hansen, J.E., and S. Lebedeff, 1987: Global trends of measured surface air temperature. J. Geophys. Res., 92, 13345-13372, doi:10.1029/JD092iD11p13345.[3] Lenssen, N., G. Schmidt, J. Hansen, M. Menne, A. Persin, R. Ruedy, and D. Zyss, 2019: Improvements in the uncertainty model in the Goddard Institute for Space Studies Surface Temperature (GISTEMP) analysis, J. Geophys. Res. Atmos., in press, doi:10.1029/2018JD029522.


Comments
Post a Comment