Posts

Showing posts with the label 30-year Trend

Debaters Behaving Badly, Part 1 - Cherry Picking Short-Term Trends
Image
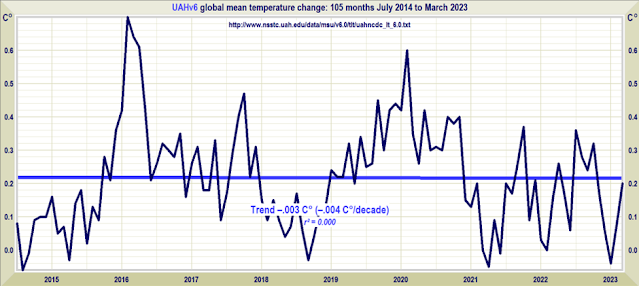
I've witnessed many debates about climate change recently in which debaters behave badly. In fairness to at least some of these debaters, many don't realize they're behaving badly. They received information they trust on blogs and YouTube videos, and they use this information in a discussions with others. But these bad tactics are still bad behavior even if we don't know it. So I thought it would be helpful to write a series on the dishonest tactics I see used in debate contexts that reflect bad behavior (either by the debater or his/her source). I'll begin with a tactic I've seen quite commonly recently - cherry picking short-term trends.  This tactic is frequently used by debaters attempting to show that global warming has "paused" or that Arctic sea ice is no longer decreasing. In the interest of brevity, I'll focus on the claim that there has been a "pause" in global warming. As we'll see, this is a  faux pause claim (I'll be...

Models and Observations for Two CMIP5 Ensemble Means

Image
I found csv file of the CMIP5 ensemble means for RCP4.5 and 8.5 on the Climate Reanalyzer website, so I downloaded both so I can do my own comparisons. I plotted multiple GMST datasets including 2 reanalyses with both RCP ensemble means from CMIP5. RCP4.5 over the last 15 years has been trending slightly warmer than observations. I don't have the 95% uncertainty envelopes, but observations here are clearly going to be well within the envelope.   But I decided to plot 30-year trends for these datasets with the expected 30 year trends in the two model ensemble means. It shows that while the models have expected a higher trends in warming over the last 15 years or so, RCP4.5 expects a steep drop off in warming rates right about now. This suggests to me that these scenarios are expecting a deceleration of our emissions in pretty substantially in ways that simply isn't happening. If current trends continue, we're likely to surpass RCP4.5 over the next decade or two, while RCP8.5...

2021 Global Mean Surface Temperatures

Image
I keep a spreadsheet of the major Global Mean Surface Temperature (GMST) datasets. The numbers for December 2021 and the year of 2021. So I plotted the data from NASA, NOAA, JMA, Berkeley Earth (BEST), and HadCRUT5. The year ended up basically in a statistical tie with 2018 as the 6th warmest year on record and both 2018 and 2021 are the warmest La Nina years on record. It's amazing to me how much agreement there is between these datasets. To illustrate, I calculated the average of all of the above and plotted the average with the 95% confidence intervals from the HadCRUT5 dataset. The average seems to consistently fall within the 95% confidence interval for HadCRUT5. I also decided to do a little calculation to update the when we can expect to hit 1.5 C if we continue at the same pace. To estimate this I used basically the same method used in the IPCC 1.5 C report. I took the HadCRUT5 dataset and calculated 30 year trends (centered) through 2005. Then I took the 30 year trend (0.2...