Forcings for Doubling CO2

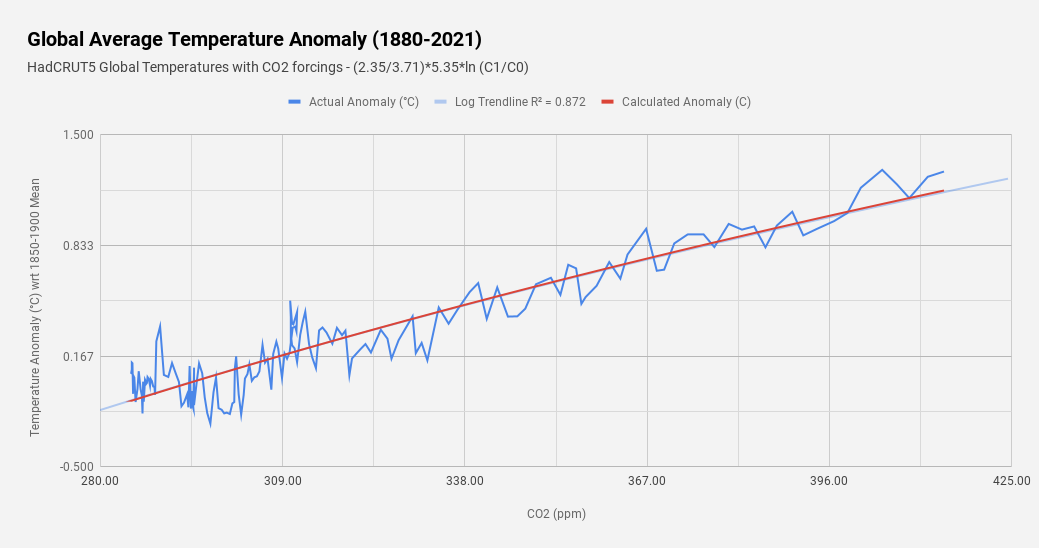
At least as far back as Myhre et al 1998 [1], scientists have understood that it's possible to approximate the effective radiative forcing (ERF, the amount of change in the outgoing energy flux near the tropopause) by a simple logarithmic equation: ΔERF ≈ α*ln(C/C0) I say "approximate" because the actual calculations for the relationship between ΔF and CO2 from line by line radiative transfer models are a bit more complex than this. The above equation is simply the result of curve fitting that matches those calculations over the range of CO2 concentrations that we're mostly concerned with. The value for α scales the radiative forcing change for the log change in CO2 concentrations. Myhre's value for α was 5.35, and this was used in the IPCC's TAR and AR4 reports. More recent IPCC reports, though, have improved the ΔF2xco2 estimates, and we can solve for the α values implied by these changes in ΔF2xco2 with α = ΔF2xco2/ln(2) ΔF2xco2 ≈ α*ln(2) AR3: 3.71 ± 0.4 W...