Plotting Temperature with CO2
 |
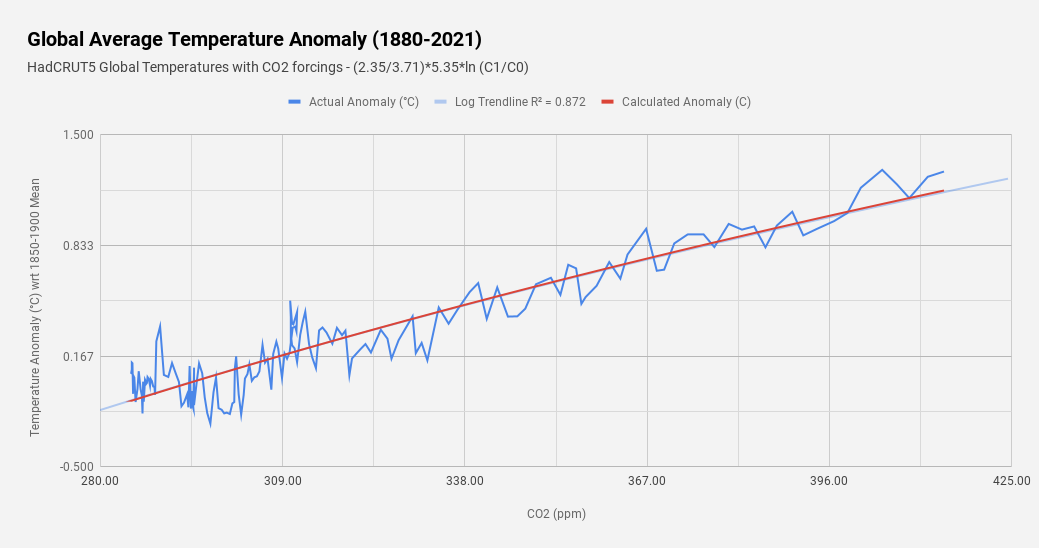
| The Best-Fit Trend assumes a "Sensitivity" of 2.35 C |
I decided to have a bit of fun playing around with CO2 and global temperature data. I downloaded CO2 concentration values from 1850 to 2021 as well as HadCRUT5 annual data, which I set to a 1850-1900 baseline, for the same time frame. I put both into a Google Sheets spreadsheet. I then calculated the expected change in temperature from the 1850-1900 mean using the formula:
dT = (S/F2x)*ln (C1/C0), where
dT = Change in temperature (C)
S = A sensitivity value.
F2x = The forcing for doubling CO2 (3.71 W/m^2)
C1 = CO2 in any given year (ppm)
C0 = Preindustrial CO2 (280 ppm)
I then plotted both the actual temp anomaly and my calculated anomaly with CO2 on the X-axis, then had my spreadsheet draw a logarithmic trend through the actual temperature data. Then I chose an S value that matched that logarithmic trend, and I came up with 2.35 C. It occurs to me that this value is too small for ECS, since this doesn't account for the current energy imbalance. It's probably closer to but not equal to TCR. My thinking is that GMST has reached equilibrium with some but not all of CO2 in the atmosphere, so it must be that TCR < S < ECS. But what is it?
It seems to me this may be a useful value for simple projections temperatures assuming we continue with business as usual (no changes in mitigation policies). So I did a couple checks on that. I put AR6 values for CO2 into my spreadsheet that were expected CO2 concentrations by 2100 under different scenarios. So using the AR6 SSPs I plugged in expected CO2 concentrations for 2100, then calculated the expected temperature anomaly using my S value and compared that value to what the IPCC projects:
It seems to me this may be a useful value for simple projections temperatures assuming we continue with business as usual (no changes in mitigation policies). So I did a couple checks on that. I put AR6 values for CO2 into my spreadsheet that were expected CO2 concentrations by 2100 under different scenarios. So using the AR6 SSPs I plugged in expected CO2 concentrations for 2100, then calculated the expected temperature anomaly using my S value and compared that value to what the IPCC projects:
Scenario CO2 IPCC MeSSP2-4.5 602.8 2.7 C 2.44 CSSP3-7.0 867.2 3.6 C 3.67 CSSP5-8.5 1135.2 4.4 C 4.58 C
I know these scenarios involve far more than CO2 increases, but it seems to me that this might be useful. It also seems like my S = 2.35 C value might be a little more sensitive than the IPCC, since it rises more steeply than the IPCC's figures do. My take on it is that my numbers maybe work for "business as usual" and maybe SSP3-7.0 best approximates business as usual, so that's why my value is closest to SSP3-7.0.
 |
| Projection Through 1000 ppm using S = 2.35 C |
I don't want to make too much of this. My work here ignores other forcings, like non-CO2 greenhouse gases, aerosols, and a whole host of other factors. But what this suggests to me is that actual empirical data we have regarding CO2 concentrations and global mean surface temperatures support the projections of the IPCC. If we don't curb our emissions, we may well be on track to exceed 3 C warming by 2100. That said, if we do continue to improve our mitigation efforts we can also avoid this, since some recent studies show that climate may be more responsive to our mitigation efforts than has previously been assumed.


Comments
Post a Comment