Plotting Temperature with CO2
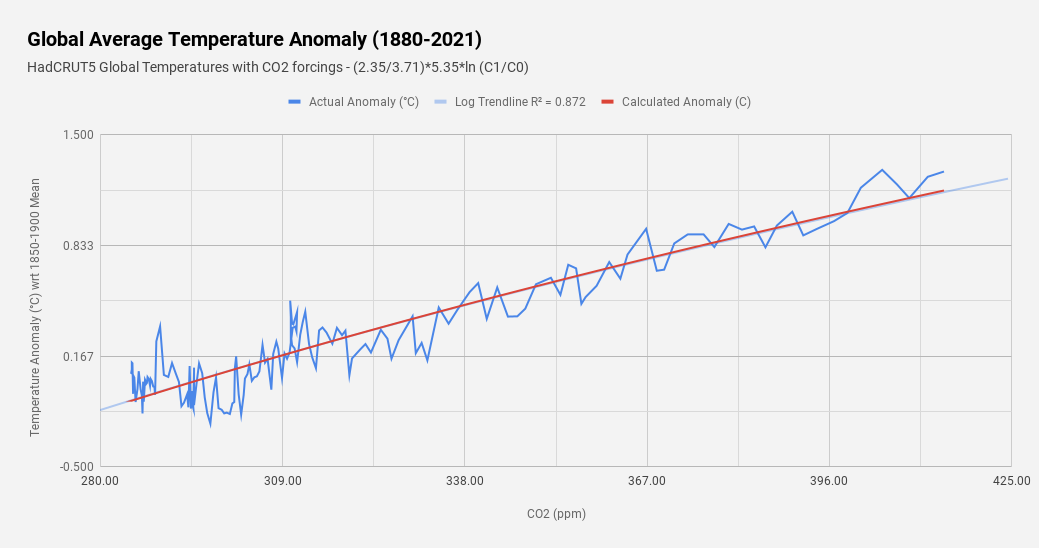
The Best-Fit Trend assumes a "Sensitivity" of 2.35 C I decided to have a bit of fun playing around with CO2 and global temperature data. I downloaded CO2 concentration values from 1850 to 2021 as well as HadCRUT5 annual data, which I set to a 1850-1900 baseline, for the same time frame. I put both into a Google Sheets spreadsheet. I then calculated the expected change in temperature from the 1850-1900 mean using the formula: dT = (S/F2x)*ln (C1/C0), where dT = Change in temperature (C) S = A sensitivity value. F2x = The forcing for doubling CO2 (3.71 W/m^2) C1 = CO2 in any given year (ppm) C0 = Preindustrial CO2 (280 ppm) I then plotted both the actual temp anomaly and my calculated anomaly with CO2 on the X-axis, then had my spreadsheet draw a logarithmic trend through the actual temperature data. Then I chose an S value that matched that logarithmic trend, and I came up with 2.35 C. It occurs to me that this value is too small for ECS, since this doesn't account for the...