Posts

Showing posts with the label Javier Vinós

Can Bray and Eddy Cycles Explain Global Warming?

Image
There's a  schematic  that is frequently promoted by John Shewchuk on X to claim thatt long-term solar cycles explain much more of temperature variability of the last 2000 years than changes in greenhouse gases like CO2. The implication is also frequently made that the current warming over the last century or so is due to these cycles and not to changes in GHG concentrations. One common version of this graph is here. The Hallstatt-Bray cycle, which has a periodicity of ~2400 years, and the Eddy cycle, which has a periodicity of 976 years, are both related to sunspots, and so they indeed do have an impact on total solar irradiance (TSI), and therefore they can in principle have an effect on global temperatures on millennial timescales. But the significant question is, by how much?  Astute observers will note that Shewchuk didn't include any scale for the y-axis; the impact of these cycles could be negligible or large as far as this schematic is concerned. I do find ironic,...

Data Tampering of Marcott by Javier Vinós

Image
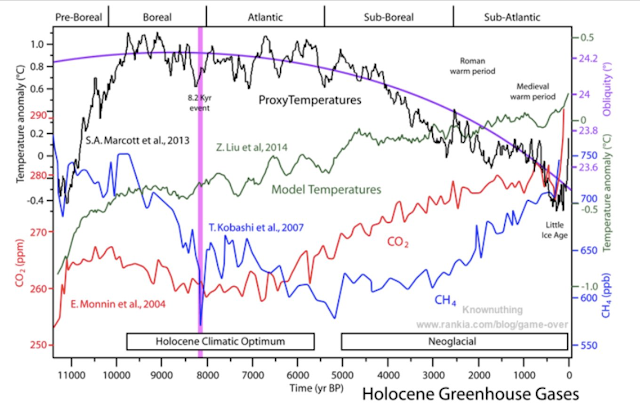
The graph above (and similar versions of it) is circulating widely on social media and promoted as evidence that the Holocene Thermal Maximum (HTM) between 5000 and 10,000 years ago was warmer than today. The graph originates from Javier Vinós' self-published book. In the graph above the black "b" time series is reported to be variability of global temperatures since the beginning of the Holocene. This particular version also shows Marcott et al 2013 as the "a" time series and Earth's obliquity as the "c" time series. My interest here has to do with the data tampering Vinós used to generate the black "b" time series, so I'm going to refer to this as the "Vinós time series." The Vinós time series is fabricated by tampering with Marcott's proxy data. In his self-published book and various blogposts, he has told us how he fabricated it. To see how he did so, we must first look at a version of this graph in which the Vinós t...

More Nonsense from Javier Vinós on Paleoclimate

Image
Today I saw a post  by  Javier Vinós on X that shows just how far he will go to lie about what paleoclimate studies teach us about our current warming trend. The text of the post w as, "I can lose weight at 1 kg/week, 4 kg/month. But not 52 kg/year or 521 kg/decade. Each kg is harder than the one before. Climate change extrapolation in models and alarmism is also wrong. The rate of warming will decrease over time until it stops." Then he shows this graph from Moberg et al 2005: Vinós' Nonsense On Curry's blog some years ago he says that the red curve is his take on Eddy cycles with a 980-year periodicity. He calculates no forcing value for these cycles, nor does he justify at all the scale he used for the sine wave's amplitude. He appears to have just calculated a sine wave with an amplitude that matches Moberg 2005 and set to a periodicity of 980 years. The clear implication of his post and graph putting both of these together is that it's impossible for th...

Is Global Warming Accelerating?

Image
There's a graph circulating on X created by Javier Vinós that is being used to suggest that global warming rates are actually decreasing. The origin of this graph comes from a WUWT blogpost , and it superficially seems convincing. The relevant graph is labeled "Figure 2," and the caption claims, "Evolution of the warming rate for 15-year periods between 1979 and 2022 in °C/decade and its linear trend, from monthly UAH 6.0 satellite temperature data." Javier Vinós Thinks Global Warming Rates are Decreasing Javier Vinós was kind enough to explain how he made this graph: "To analyze the evolution of the warming rate, we subtract from each monthly data the previous one to calculate the monthly increase. We then deseasonalize the monthly increase by finding the 12-month moving average to remove a lot of the noise. Finally, we calculate the 15-year average warming rate in °C/decade by calculating the 180-month moving average and multiplying the resulting data by ...

Contrarian Manipulation of Paleoclimate Data

Image
  Now that 2023 is in the books, it's pretty clear that all global temperature datasets will show 2023 to be the warmest year on record by a significant margin. And since 21st century has exceeded the warmest temperatures of the Holocene (the current interglacial), it's also fair to say that 2023 has likely been the warmest year at least since the last interglacial ended 125K years ago. I'm going to wait until all the major datasets are updated to 2023 before saying more about 2023. But already the dishonesty from contrarians is coming out to spin 2023 into something other than what it actually was. Patrick Moore's Dishonesty Patrick Moore posted a tweet with the above graph claiming that what I summarized about 2023 above is an "outright lie." His words: The claim is being made that “2023 was the hottest year in 125,000 years”. This is an outright lie. The Holocene Climatic Optimum from about 10,000-5,000 years ago, when the Sahara was green, was warmer than...

Clintel Attempts an Analysis of AR6

Image
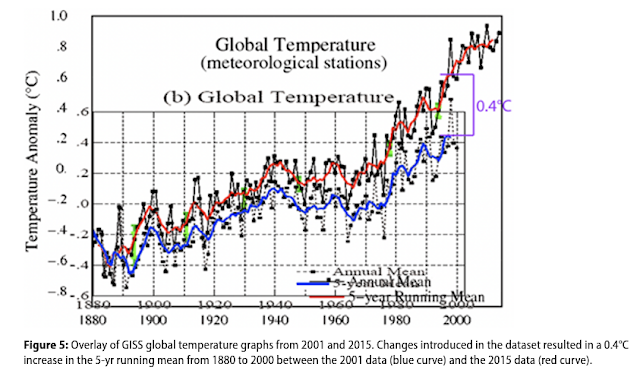
Just recently an organization called Clintel (a combination of Climate and Intelligence) published a document called The Frozen Climate Views of the IPCC: An Analysis of AR6.  Virtually none of this document has any substantial analysis of AR6. It basically regurgitates talking points that have been debunked for decades. The authors apparently compiled them into a single document with superficial references to AR6.  I'd like to highlight what I consider the one of the most humorously dishonest parts of the document. I have a page with an outline of Clintel's document and links to rebuttals of their arguments here . Clintel's Critique of the Instrumental Record In a chapter entitled "No confidence that the present is warmer than the Middle Holocene," Clintel wants to make the claim that we don't have enough certainty regarding the proxy evidence and the instrumental record to know if current temperatures are warm with respect to the Holocene. In an attempt to s...