Contrarian Manipulation of Paleoclimate Data
Now that 2023 is in the books, it's pretty clear that all global temperature datasets will show 2023 to be the warmest year on record by a significant margin. And since 21st century has exceeded the warmest temperatures of the Holocene (the current interglacial), it's also fair to say that 2023 has likely been the warmest year at least since the last interglacial ended 125K years ago. I'm going to wait until all the major datasets are updated to 2023 before saying more about 2023. But already the dishonesty from contrarians is coming out to spin 2023 into something other than what it actually was.
Patrick Moore's Dishonesty
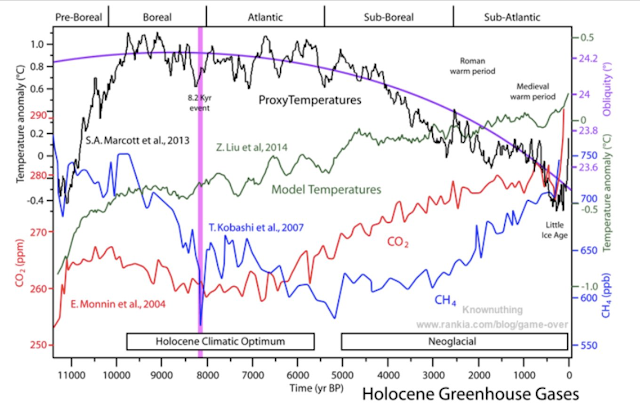
Patrick Moore posted a tweet with the above graph claiming that what I summarized about 2023 above is an "outright lie." His words:
The claim is being made that “2023 was the hottest year in 125,000 years”. This is an outright lie. The Holocene Climatic Optimum from about 10,000-5,000 years ago, when the Sahara was green, was warmer than this Modern Warm Period.
But if the graph he shared was intended to demonstrate that 2023 isn't the warmest of the Holocene, it failed. In fact, the graph is a convoluted mess. The CH4 time series is attributed to Kobashi et al 2007, but it looks like it actually comes from either from Grachev et al 2007[1] or Monnin et al 2004[2]. I suspect both the CO2 and CH4 time series come from the latter. The "model temperatures" are strangely put on a different temperature scale from the proxy temperatures, but that time series actually does come from Liu et al 2014, which was a very important paper on the "Holocene Temperature Conundrum." The paper discusses the discrepancy between the models (which generally show slowly increasing temperatures throughout the Holocene with increasing CO2) and Marcott's reconstruction of global temperatures in the Holocene published 2013.[6]
 |
| Liu et al 2014 |

Patrick Moore doesn't tell you any of this, though. Instead he shows a "proxy temperature" time series that he attributed to Marcott et al 2013. The problem, though, is that this time series doesn't come from Marcott. It's actually a manipulated version of Marcott's proxy data created by Javier Vinós. Vinós took Marcott's proxies and manipulated them to make the HTM warmer. In Marcott's reconstruction (see below) warmest and coolest portions of the preindustrial Holocene differ by about half the amount of Vinós' version. And of course, all the time series in Moore's graph end in 1950. The instrumental record is missing, so his graph is missing the last 73 years of global warming. It's amazing to me that he thinks he can show that it's a "lie" that 2023 is the warmest of the last 125K years while displaying a graph that omits the last 73 years of global warming.
 |
| Marcott 2013 |
Javier Vinós' Dishonesty

 |
| Map of "biological, glaciological, and marine sedimentary evidence" used in Marcott 2013, from Figure S1 |

Conclusion
The graph shared by Moore is also in Vinós' post on Curry's blog. I've seen several versions of this graph in various places, including Andy May's blog and in a manuscript by Nicola Scafetta. There is plenty of dishonesty involved here, and Moore and Vinós are not the only people to blame. But Moore (and other contrarians) want us to think of them as skeptics. Even if Moore wasn't aware of Vinós' dishonesty, at best he wasn't skeptical here. He took a dishonest graph and used it to make an invalid point. And anyone can see that the graph ignored the last 73 years of global warming; it does not even place 2023 on the graph. In point of fact, seasonal biases affecting Marcott et al 2013 probably make the HTM too warm, but even if we use Marcott instead of Osman, temperatures have increased above the warmest temperatures of the Holocene.[1] Grachev, A. M., E. J. Brook, and J. P. Severinghaus (2007), Abrupt changes in atmospheric methane at the MIS 5b–5a transition, Geophys. Res. Lett., 34, L20703, doi:10.1029/2007GL029799.
[2] Eric Monnin, Eric J Steig, Urs Siegenthaler, Kenji Kawamura, Jakob Schwander, Bernhard Stauffer, Thomas F Stocker, David L Morse, Jean-Marc Barnola, Blandine Bellier, Dominique Raynaud, Hubertus Fischer. Evidence for substantial accumulation rate variability in Antarctica during the Holocene, through synchronization of CO2 in the Taylor Dome, Dome C and DML ice cores. Earth and Planetary Science Letters, Volume 224, Issues 1–2 (2004): 45-54. https://doi.org/10.1016/j.epsl.2004.05.007.[3] Liu, Z., Zhu, J., Rosenthal, Y., Zhang, X., Otto-Bliesner, B. L., Timmermann, A., … Elison Timm, O. (2014). The Holocene temperature conundrum. Proceedings of the National Academy of Sciences, 111(34), E3501–E3505. doi:10.1073/pnas.1407229111.
[4] Bova, S., Rosenthal, Y., Liu, Z. et al. Seasonal origin of the thermal maxima at the Holocene and the last interglacial. Nature 589, 548–553 (2021).
https://doi.org/10.1038/s41586-020-03155-x
[5] Osman, M.B., Tierney, J.E., Zhu, J. et al. Globally resolved surface temperatures since the Last Glacial Maximum. Nature 599, 239–244 (2021). https://doi.org/10.1038/s41586-021-03984-4
[6] Marcott, Shaun et al. “A Reconstruction of Regional and Global Temperature for the Past 11,300 Years.” Science 339 (2013): 1198-1201. http://shpud.com/Science-2013-Marcott-1198-201.pdf


Comments
Post a Comment