Posts

Showing posts with the label homogenization

Tony Heller On US Temperatures

Image
Tony Heller made the following mashup of two graphs intended to show that NASA lies about CONUS temperatures as part of a criminal conspiracy to fabricate global warming. It will be very easy to show that Tony Heller is the one lying.  It took about 5 minutes for me to document why the bottom graph is an improvement over the top graph, and there's nothing "inexplicable" about it. The information needed to explain the changes comes a  page on NASA's website that documents the developments and improvements to the GHCN station dataset over time. NASA isn't hiding anything. A subset of this network was used to form the USHCN dataset that was used by NASA and NOAA until 2014.  Here are some relevant updates introduced since the top 1999 graph: In 1999, USHCN was expanded from 138 to 1062 stations.[1] And NASA's methodology improved to account for station moves that corrected for unrealistic outliers. Areas with missing data were filled in, meaning that the area-we...

Correcting for Time of Observation Bias

Image
You'll frequently see contrarian influencers on social media showing the differences between "raw" and "adjusted" temperatures for the United States that indicate that CONUS warming in the "adjusted" temperatures is greater than in the "raw" data. We're often told this indicates that scientists have adjusted CONUS temperatures to make them cooler in the past, thus making the amount of warming that has occurred in the US larger in the "adjusted" temperature data than in the "raw" data. It's then frequently just assumed that this is because "liberal" scientists need are conspiring with nefarious intent to tamper with and manipulate temperature data to create artificial warming trends in US temperatures. In another post I share some dishonest way in which contrarians exaggerate the difference between the "raw" and adjusted temperatures, but even in properly plotted comparisons, the final "adju...

Bias Correction in Surface Thermometer Datasets

Image
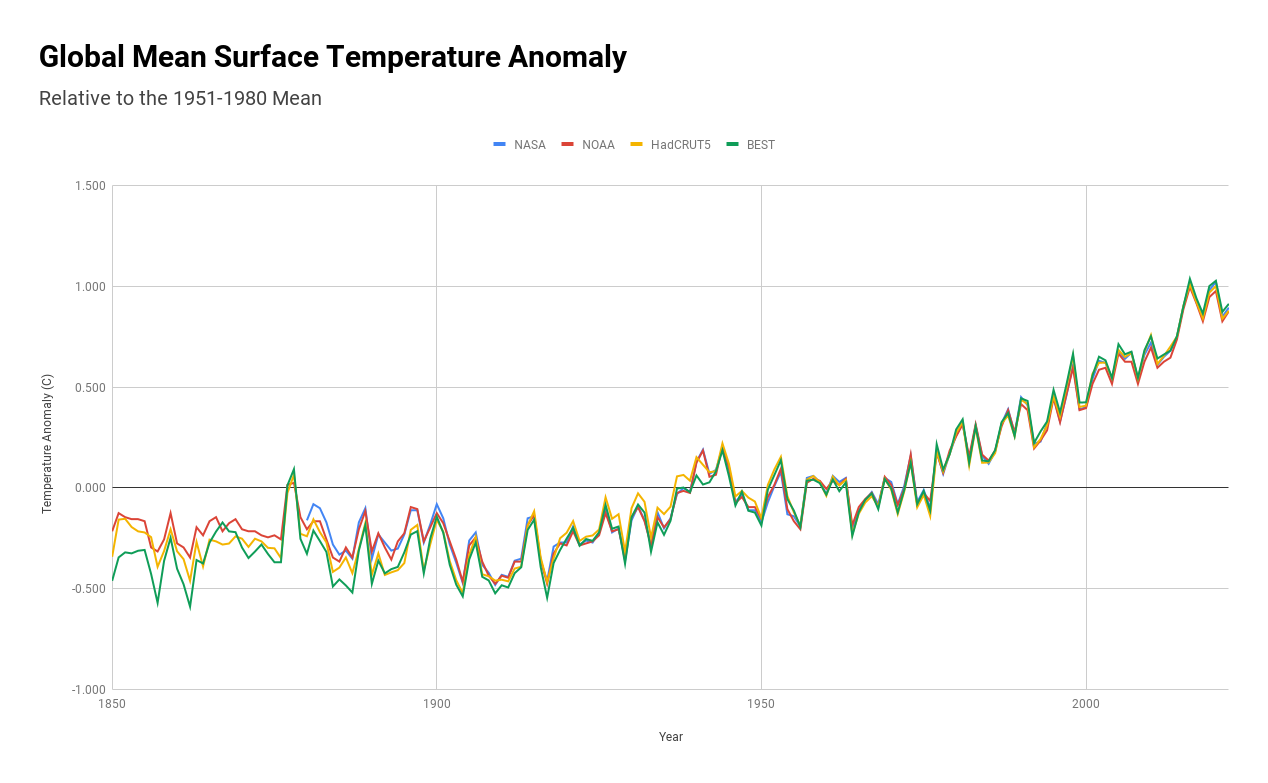
Virtually all temperature datasets that have been around for a significant amount of time depend on surface thermometers, most of which were not designed to measure climate changes; they were positioned to collect meteorological data for temperature and precipitation, and many of these stations have been maintained by volunteers. In earlier years there was no standardized process for even when temperatures were recorded. Daily temperatures were calculated using max-min thermometers that recorded the "max" and "min" temperatures recorded by the thermometer since the last time it was checked and reset. If the thermometer was checked daily, this would give data for daily highs and lows. The average temperature for the data as calculated simply by Tavg = (Tmax + Tmin)/2. Biases can easily enter into the temperature record by systematic changes in 1) time of observation , 2) instrument technology, and 3) urbanization, as well as other factors. Likewise, sea surface tempe...