Posts

Showing posts with the label global warming

What Counts as Geologically Rapid Warming?

Image
I frequently hear people downplay the claim that the 1.3°C warming above the 1850-1900 mean is geologically significant. I hear words like "slight" or "modest" or "insignificant" thrown around a lot. And certainly global temperatures have increased by a lot more than 1.3°C on geologic time scales. My first response is typically to point out that on geologic time scales, global temperatures do change a lot, but at much slower rates. Current warming rates are exceptional, even on geologic time scales. And I think this point can be relatively easily demonstrated with the evidence we have, even taking into consideration the fact that proxies do not preserve a high degree of temporal resolution, and actual warming rates may exceed what we can detect with proxy evidence. I think we need a two part response to this. Defining Geologically "Rapid" Warming Since terms like "rapid" are relative terms, I think we need to come up with a standard for...

How Have Contrarian Climate Predictions Performed?

Image
If you follow popular discussions about AGW, you'll likely see many claims that climate scientists have been making terrible predictions and climate models invariably run too hot compared to observations. If you investigate these, almost all of so-called "predictions" of climate scientists turn out to be some combination of misinformed assessments by media personalities, reporters and politicians or claims by scientists that have been misread by contrarians. And while it's true that some climate scientists have said some things that have not panned out, this is clearly the exception, not the rule. In fact, overall, climate scientists have been slightly conservative with their predictions, and climate model have performed quite well.[1] In fact, Zeke Hausfather has done a pretty good job of tracking how model predictions compare to observations, and overall, they've done quite well. So given all the rancor from contrarians about the predictions of climate scientist...

Dr. Matthew Wielicki Attempts Math

Image
Today I came across a post on X from Dr. Matthew Wielicki in which he claims that warming from 1916 - 1942 was the same amount as from 1998 - 2024. Both time periods show +0.6°C warming. Since CO2 was lower and "more stable," Wielicki claims that "This one chart delivers a devastating blow to the core climate narrative, that recent warming is both unprecedented and primarily caused by human CO₂ emissions." Here's the chart he shared. There are times when I'm simply amazed at the level of stupidity coming from contrarian influencers, especially among those that certainly know better. His own bio on X says, "Dr. Matthew Wielicki stands as a beacon of rational thought. With a Ph.D. in earth science from UCLA and as a professor-in-exile, he bravely challenges the norms that many in the scientific community only whisper about." So Wielicki is claiming to have the expertise to offer rational criticism of the norms of within climate science. How did he ...

RIP, Temperature.Global

Image
A few years ago, I began seeing contrarians promoting data from a website called temperature.global (TG), a website that claimed to publish global temperatures. According to their description, TG "calculates the current global temperature of the Earth. It uses unadjusted surface temperatures. The current temperature is the 12M average mean surface temperature over the last 12 months compared against the 30 year mean. New observations are entered each minute and the site is updated accordingly. This site was created by professional meteorologists and climatologists with over 25 years experience in surface weather observations." The website was run anonymously; to my knowledge, nobody knows exactly who is behind it. I corresponded with at least one of the people who ran the website, and he/she used the initials TG for the person's name. In another post I documented some of the failures of the website after seeking clarification from TG. The more I corresponded with TG, th...

Is Global Warming Accelerating?

Image
There's a graph circulating on X created by Javier Vinós that is being used to suggest that global warming rates are actually decreasing. The origin of this graph comes from a WUWT blogpost , and it superficially seems convincing. The relevant graph is labeled "Figure 2," and the caption claims, "Evolution of the warming rate for 15-year periods between 1979 and 2022 in °C/decade and its linear trend, from monthly UAH 6.0 satellite temperature data." Javier Vinós Thinks Global Warming Rates are Decreasing Javier Vinós was kind enough to explain how he made this graph: "To analyze the evolution of the warming rate, we subtract from each monthly data the previous one to calculate the monthly increase. We then deseasonalize the monthly increase by finding the 12-month moving average to remove a lot of the noise. Finally, we calculate the 15-year average warming rate in °C/decade by calculating the 180-month moving average and multiplying the resulting data by ...

Ole Humlum on CO2 Lagging Temperature

Image
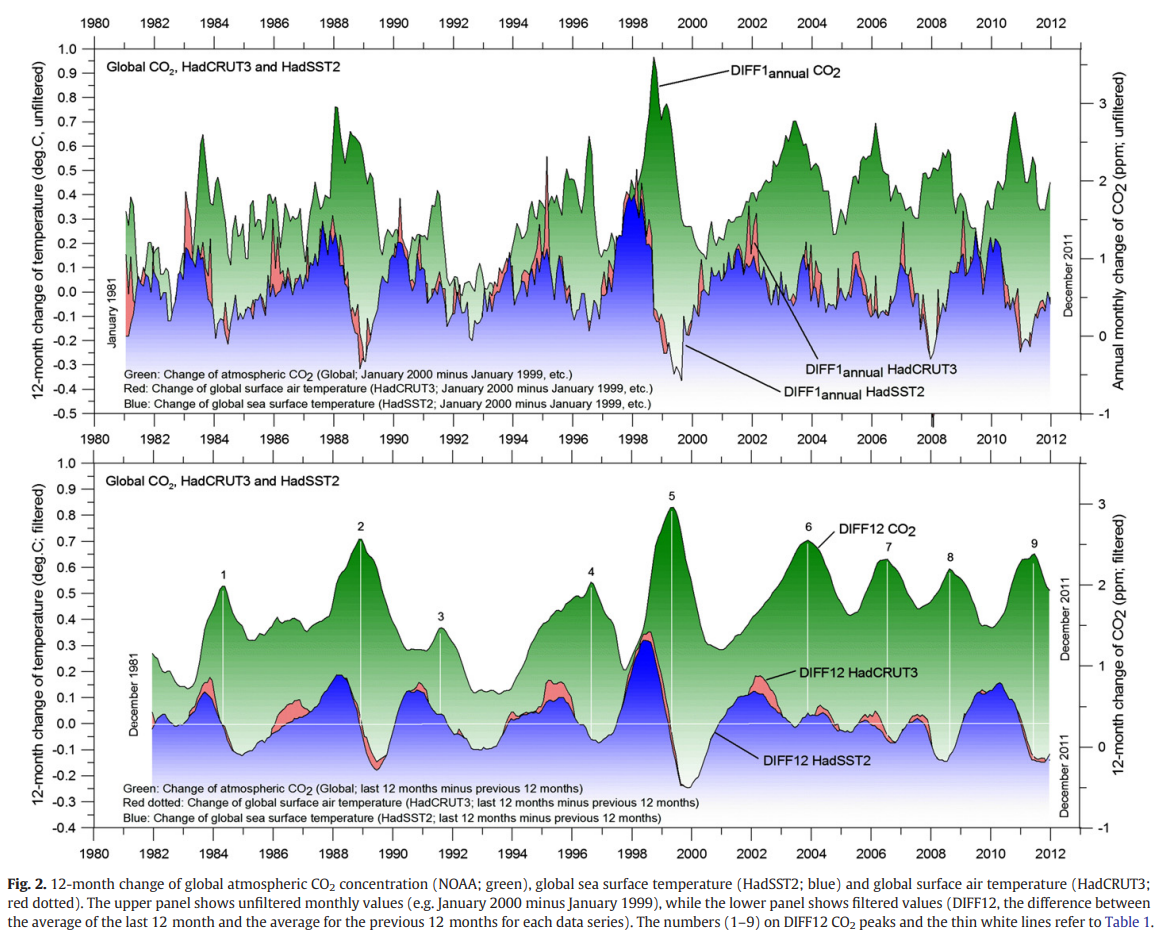
Ole Humlum published a paper about 10 years ago attempting to show that CO2 always lags temperature and therefore the increase in CO2 substantially comes from an increase in temperature, not the other way around. In the words of Humlum's paper, As cause always must precede effect, this observation demonstrates that modern changes in temperatures are generally not induced by changes in atmospheric CO2. Indeed, the sequence of events is seen to be the opposite: temperature changes are taking place before the corresponding CO2 changes occur. and  CO2 released from anthropogene [sic] sources apparently has little influence on the observed changes in atmospheric CO2, and changes in atmospheric CO2 are not tracking changes in human emissions.  What I want to show two things here. First, Humlum's argument is fatally flawed logically, and he has to hide that flaw with by detrending the data. Second, even if we were take his claims, it leads to absurd conclusions. Humlum's Fatal Log...

Does Rosenthal et al 2013 Contradict Climate Science?

Image
A paper was published in 2013[1] that reconstructed intermediate water temperatures (IWT) for an area of Indonesian waters around the Makassar Straight and the Flores Sea. The study includes two reconstructions, one at 500 m depth and another at 600 m to 900 m depth in an effort to show how Pacific IWT ha sbeen affected by high latitude source waters. The reconstruction somewhat predictably found that during the HTM, average IWT in this area were warmer than in 1970. Given the misuse of this paper by contrarians (see below), I think it best to quote directly from the paper so you can see precisely what this paper is actually about. The early Holocene warmth and subsequent IWT cooling in Indonesia is likely related to temperature variability in the higher-latitude source waters. To assess the mechanisms that caused these hydrographic variations, we estimate down-core salinities and densities for the 500- and 600- to 650-m depths. A temperature-salinity-density plot suggests that althoug...