Ole Humlum on CO2 Lagging Temperature
Ole Humlum published a paper about 10 years ago attempting to show that CO2 always lags temperature and therefore the increase in CO2 substantially comes from an increase in temperature, not the other way around. In the words of Humlum's paper,
As cause always must precede effect, this observation demonstrates that modern changes in temperatures are generally not induced by changes in atmospheric CO2. Indeed, the sequence of events is seen to be the opposite: temperature changes are taking place before the corresponding CO2 changes occur.
and
CO2 released from anthropogene [sic] sources apparently has little influence on the observed changes in atmospheric CO2, and changes in atmospheric CO2 are not tracking changes in human emissions.
What I want to show two things here. First, Humlum's argument is fatally flawed logically, and he has to hide that flaw with by detrending the data. Second, even if we were take his claims, it leads to absurd conclusions.
Humlum's Fatal Logical Flaw
The error in logic here should be obvious. The fact that changes in temperature precede changes in CO2 does not imply at all that the overall increase in CO2 is caused by temperature. Humans currently vent 11 GtC/year to the atmosphere through our fossil fuel emissions and land use change. Using numbers from the 2024 Carbon Budget, since 1750, human emissions total ~720 GtC, but only ~300 GtC remains in the atmosphere. We know this because CO2 has increased by 140 ppm, and
ppmCO2 = 300 GtC * 3.67 GtCO2/GtC * 0.128 ppm/GtCO2 = 141 ppmCO2
The rest of our emissions have been taken up by land and ocean sinks. In fact, human emissions total ~2.4x atmospheric growth. To put that into perspective, in 1850, atmospheric CO2 was ~280 ppm or ~600 GtC. Human emission since then was about 20% greater than the atmospheric content, and that was sufficient to increase CO2 to 420 ppm or 900 GtC with the land and ocean sinks taking up the difference between human emissions and atmospheric growth.
However, since CO2 is less soluble in warmer water, the ocean sink takes up less CO2 during El Niño years than during La Niña years. Human carbon emissions are driven mostly by economics, and interannual variability is small, so interannual variability in CO2 growth tracks with ENSO, even while the overall increase comes from human activity.
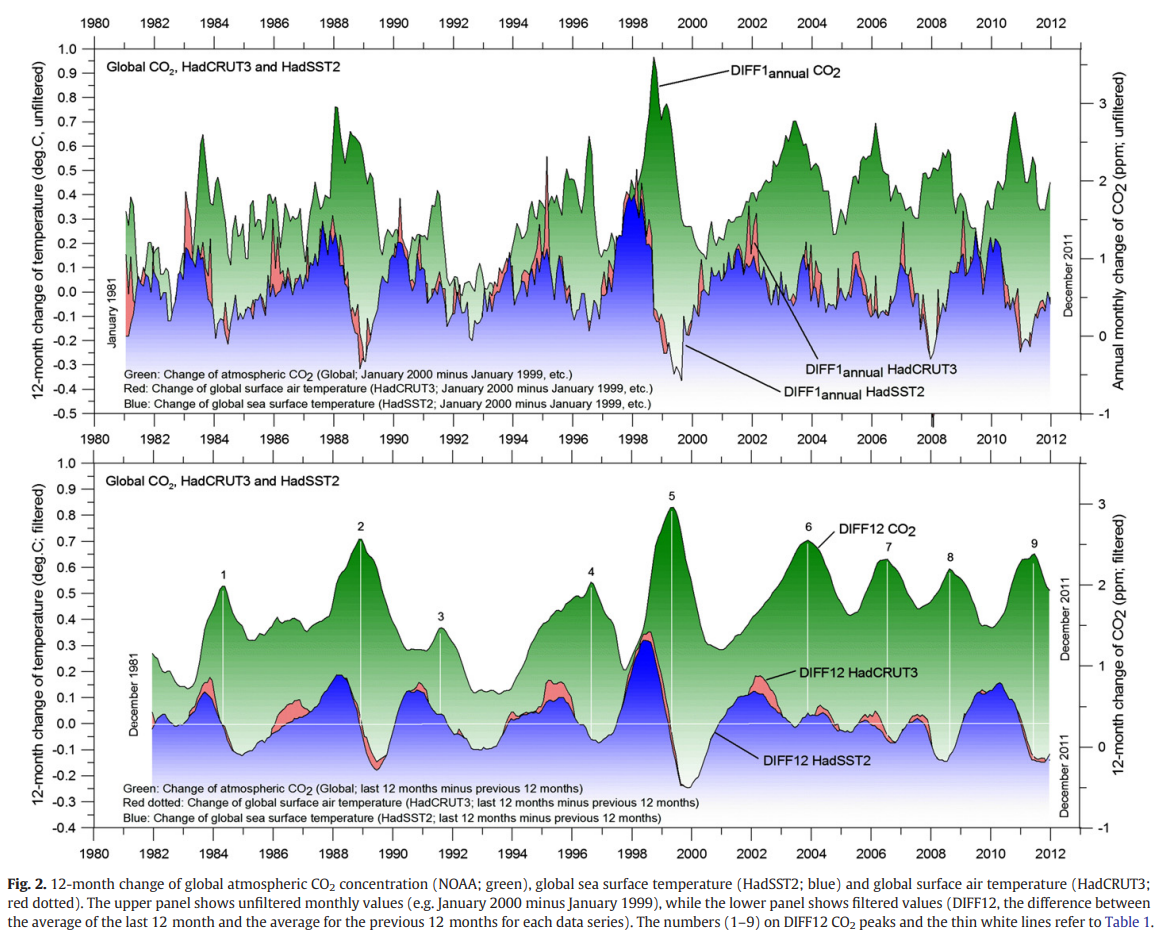
So inevitably papers like this have to find ways to hide the fact that human emissions total ~2.4x atmospheric growth. To do this Humlum compares monthly and/or annual changes in CO2 and temperature, rather than the overall increases in CO2 and temperature. By looking at monthly changes in CO2 and temperature, they essentially detrend the data, hiding the increases in CO2 and temperature, which is precisely the data you need to look at. Since CO2 is less soluble in warmer temperatures, Humlum's graph shows us exactly what we'd expect to see even if human activity is responsible for all of the atmospheric growth of CO2. The oceans outgas more CO2 when they are warmer, and since global temperatures are warmer in NH summers than in NH winters, so we'd expect to see seasonal increases CO2 lagging NH summers. El Niño years are warmer than La Niña years, so we'd expect to see increases in CO2 lagging the warm months of El Nino years. Ole Humlum's graph showing a seasonal lag of CO2 changes behind temperature changes is both valid and completely irrelevant. In fact, this is documented in the literature.[5] But Humlum simply hid the relevant signal (the overall increase) by essentially showing the derivative of CO2 and temperature instead of the overall increases of both. Below I show how this works. The red line plots GMST from HadCRUT5 with a roughly linear increase of 0.018 C/year. However, Humlum's differencing method (blue) and 12-month slopes (black) have slopes near 0 but the mean value of each is roughly identical to the linear slope of HadCRUT5. This is to be expected because the derivative of any line y = mx+b is y' = m.
.png)
Below I did my own version of Humlum's graph. I took data from the Keeling Curve and calculated running annual slopes for the graph and then added 12-month smoothing. Then I took HadCRUT5 and HadSST4 and did the same thing to these. Here's the graph from 1960 to 2023. Since CO2 is accelerating, the CO2 portion of the graph not fully detrended, but since temperature increases has been closer to linear, that is essentially detrended.
.png)
Absurd Conclusions
An evaluation of Humlum's graph (or mine above) essentially shows that his paper makes absurd conclusions about temperature and CO2. Let's do some back of the envelope calculations from what Humlum's graph shows. The scale on the left shows a change in temperature (ΔT) range of 1.4°C/year. The scale on the right shows a corresponding ΔCO2 of 4.5 ppm/year. So we can say roughly that the ΔCO2 and ΔT relationship is in the neighborhood of 4.5/1.4 or ~3.2 ppm/°C. In other words, from this graph we should expect a 3.2 ppm increase in CO2 for every 1°C increase in temperature. Since GMST has increased by 1.3°C, this relationship implies a ΔCO2 of only ~4 ppm. Except CO2 has increased by ~140 ppm. Where did the other 136 ppm come from? Humlum can't say.
If on the other hand, we accept Humlum's conclusion that the ΔCO2 = 140 ppm above preindustrial levels is due to ΔT, then things get absurd pretty quickly. For ΔCO2 to be caused entirely by ΔT, we'd have to have a 140/3.2 or 44°C increase in GMST to produce a 140 ppm increase in GMST at the rates implied by Humlum's graph. Since the planet has only warmed by 1.3°C, Humlum's conclusion is absurd. The absurdity goes away if we acknowledge that Humlum is confusing causes of seasonal variability in CO2 with the cause of the overall increase in CO2 concentrations.
In the graph below I show data from the 2024 Carbon Budget[2] with human emissions on the positive side of vertical scale and with sinks and atmospheric growth on the negative. You can see there's a significant amount of annual variability in the sinks and atmospheric growth compared to the emissions sources, but overall, total anthropogenic emission sources from fossil fuels and industry (FFI) and land use change (LUC) are about the same magnitude as the land/ocean sinks with atmospheric growth. The budget balances if human activity is responsible for virtually all the increase in CO2.
%20(1).png)
It turns out that the relationship between how the solubility of CO2 in seawater is affected by temperature is pretty well understood. As the oceans warm, the ocean to atmosphere flux (Foa) increases linearly with temperature. This is governed by the following equation[6]:
Foa = 0.3*ΔSST gCO2/m^3
So if SSTs have increased by 1°C, then Foa has contributed 0.3 gCO2/m^3 to the atmosphere, which amounts to 0.3*600*360/1000 = 64.8 GtCO2 (17.7 GtC). However, Henry's Law states that at equilibrium the amount of CO2 dissolved in sea water will increase proportionately with the partial pressure of CO2, and the amount of CO2 in the oceans is strongly affected by the behavior of the HCO3-/CO3-- buffering system. Increasing atmospheric CO2 also causes an atmosphere to ocean CO2 flux (Fao) which roughly follows a (very) simplified equation:
Fao = 8.66*ln (C/280) gCO2/m^3
At 420 ppm, therefore, the ocean sink will take up 3.51 gCO2/m^3 or 758 GtCO2 (207 GtC). Overall the oceans are a carbon sink taking up about 693 GtCO2 (189 GtC). In other words, the flux of CO2 from the atmosphere to the oceans caused by the increase in atmospheric CO2 is about 10x greater than the flux of CO2 from the oceans to the atmosphere due to increasing temperature.
%20(1).png)
The above graph from the 2024 Carbon Budget shows that since monthly records for CO2 began at Mauna Loa in 1958, atmospheric growth in CO2 has about the same magnitude and slope as human emissions with natural (land/ocean) sinks subtracted from the human total. There is simply no room in the carbon budget for a significant fraction of ΔCO2 to come from ΔT.
There are numerous other problems with this paper that are described in two comments[3][4]. However, while the paper is flawed on so many levels, it is interesting to me that the graph does illustrate something meaningful (though you can get the same insights from Wang et a 2013[5]). Rates of CO2 variability do appear to lag temperature variability by a few months. Equally interesting is that a paper got published that attempts to show that the long-term increase in CO2 is caused by increases in temperature using a methodology that removed the long-term trends in CO2 and temperature. In the words of Richardson's comment, "Humlum et al., 2013 identify natural controls on short term variation
in atmospheric CO2 using a differential method that removes long term
trends and emphasises short term changes. They proceed to make conclusions about the long term change in atmospheric CO2 since January
1980, despite having removed most of the long term contribution
through differentiation."[3] That sums it up quite nicely.
Note: This post updated 4/22/2025
References:
[1] Ole Humlum, Kjell Stordahl, Jan-Erik Solheim, The phase relation between atmospheric carbon dioxide and global temperature, Global and Planetary Change, Volume 100, 2013, Pages 51-69, ISSN 0921-8181. https://doi.org/10.1016/j.gloplacha.2012.08.008.
[2] 2024 Carbon Budget. https://essd.copernicus.org/articles/15/5301/2024/
[3] Richardson, M. (2013). Comment on “The phase relation between atmospheric carbon dioxide and global temperature” by Humlum, Stordahl and Solheim. Global and Planetary Change, 107, 226–228. doi:10.1016/j.gloplacha.2013.03.0
[4] Masters, T., & Benestad, R. (2013). Comment on “The phase relation between atmospheric carbon dioxide and global temperature.” Global and Planetary Change, 106, 141–142. doi:10.1016/j.gloplacha.2013.03.010
[5] W. Wang, P. Ciais, R.R. Nemani, J.G. Canadell, S. Piao, S. Sitch, M.A. White, H. Hashimoto, C. Milesi, & R.B. Myneni, Variations in atmospheric CO2 growth rates coupled with tropical temperature, Proc. Natl. Acad. Sci. U.S.A. 110 (32) 13061-13066, https://doi.org/10.1073/pnas.1219683110 (2013).
[7] Millero et. al. Dissociation constants for carbonic acid determined from field measurements. Deep-Sea Research I 49 (2002) 1705–1723. https://www.gfdl.noaa.gov/bibliography/related_files/millero0201.pdf
[8] Roy, R. N., L. N. Roy, K. M. Vogel, C. Porter-Moore, T. Pearson, C. E. Good, F. J. Millero, and D. M. Campbell (1993), The dissociation constants of carbonic acid in seawater at salinities 5 to 45 and temperatures 0 to 45°C, Mar. Phys. Chem. - Mem. Contrib., 44, 249–267, doi:10.1016/0304-4203(93)90207-5.
[8] Millero, Frank, and Denis Pierrot. “Dissociation Constants of Carbonic Acid in Seawater as a Function of Salinity and Temperature.” Marine Chemistry, 2006.
[8] Millero, Frank, and Denis Pierrot. “Dissociation Constants of Carbonic Acid in Seawater as a Function of Salinity and Temperature.” Marine Chemistry, 2006.


Comments
Post a Comment