Posts

Showing posts with the label wuwt

Gross Incompetence and Trickery at No Trick Zone

Image
The popular contrarian blog No Trick Zone has made a name for itself for compiling lists of papers that are claimed to demonstrate that some aspect of climate science is all wrong. The papers in these lists generally fall into a few categories: Papers published in junk (pay-to-play) or predatory journals. Papers published in legitimate journals that don't say what NTZ claims they say. Papers published in legitimate journals that do in fact challenge some aspect of AGW. Studies show that papers in the third category total less than 1% of the recent peer-reviewed literature, so you have to wade through a ton of papers in the first two categories to find the one(s) that belong in the third. It used to be when people promoted these NTZ blogposts on social media, I'd go through the trouble of looking up the papers to confirm that the general principle I describe above still holds true. I no longer waste my time with that (Brandolini's Law and all), but occasionally WUWT picks u...
This is Just Too Funny

Image
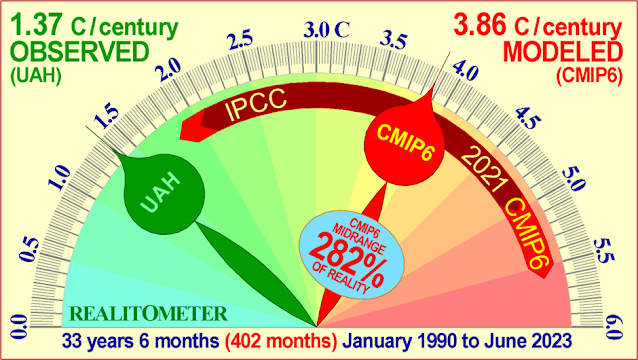
Two things happened recently at Watts Up With That , and the combination of the two, I think is rather hilarious. Observant readers will know that contributors to WUWT regularly claim that climate models are "alarmist" because they overestimate how much warming has occurred. My favorite of these is Christopher Monckton, who provides us with a steady dose of this kind of rhetoric. There are two necessary components to his tactic: He regularly exaggerates how much warming models predict. In a recent post , he claims CMIP6 models predict 0.386° C /decade warming. He regularly cherry picks short-term trends beginning somewhere around 2014 or 2015 to claim that there has been a pause in global warming in the UAH lower troposphere dataset. I blogged about this in my first post on debaters behaving badly . UAH has a long-term warming rate of about 0.13° C /decade. From this he claims that models predict 282% too much warming. Here's how Monckton portrays this: Monckton on Models...

Debaters Behaving Badly, Part 2 - Using Scales to Hide the Incline

Image
In  Part 1  of this series on debaters behaving badly, we saw how some debaters behave badly by misusing short-term trends to claim that global warming has paused, leading to the proliferation of what I consider faux pause claims on the internet and social media. Here in Part 2, I'd like to consider the next most popular tactic I see used frequently in climate debates - using dishonest scales to make false claims about global temperatures or the correlation between temperatures and carbon dioxide. Misusing Scale to "Hide the Incline" of Global Temperatures One of the largest repositories of bad debate behavior on the internet is on the Watts Up With That blog. Anthony Watts recently wrote a post complaining about accurate reporting of global temperature anomalies and decided to replace them with his substitute version , which you can find on a side bar of his blog whenever you visit. It looks like this: To do this, Watts replaced the baseline temperature value of the G...

Why Short-Term Trends are Misleading

Image
In a recent post by Willis Eschenbach[1] at the Watts Up With That blog, we are again being told that there has been a recent decline in global temperatures. The argument was that a breakpoint analysis of multiple datasets reveals a break around 2015, and trends following that breakpoint are either flat or cooling. Yet it's completely unsurprising that such a breakpoint was found in 2015, since that was the beginning of a very large El Nino, and we haven't had a significant El Nino since. Instead, La Nina conditions have prevailed. Yet, the following is indisputable from the GMST data we have: 1. El Nino years are warming at about the same rate as La Nina years (both are warming at 0.2 C/decade since 1980). 2. El Nino years average almost 0.2 C warmer than La Nina years (the difference in the Y direction between the red and blue lines above). 3. The AGW warming signal is about 0.2 C/decade since 1980. 4. ENSO cycles between El Nino and La Nina inside of decadal time scales. Tha...