This is Just Too Funny
Two things happened recently at Watts Up With That, and the combination of the two, I think is rather hilarious. Observant readers will know that contributors to WUWT regularly claim that climate models are "alarmist" because they overestimate how much warming has occurred. My favorite of these is Christopher Monckton, who provides us with a steady dose of this kind of rhetoric. There are two necessary components to his tactic:
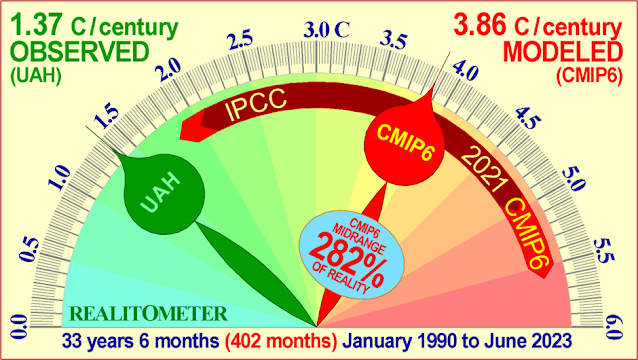
- He regularly exaggerates how much warming models predict. In a recent post, he claims CMIP6 models predict 0.386°C/decade warming.
- He regularly cherry picks short-term trends beginning somewhere around 2014 or 2015 to claim that there has been a pause in global warming in the UAH lower troposphere dataset. I blogged about this in my first post on debaters behaving badly. UAH has a long-term warming rate of about 0.13°C/decade. From this he claims that models predict 282% too much warming.
 |
| Monckton on Models and Observations |
.png) |
| TG's Graph Has a Slope of 0.389°C/decade |
What Watts didn't do, though, is look at how their temperatures have changed since 2015 when the dataset began. I did. I took each of their monthly values and plotted them on a graph and calculated the trend. Now here I must confess I'm following standard Monckton & WUWT cherry-picking rules here. On WUWT, statistically insignificant trends are just fine. That is, if we treat TG like Monckton and WUWT treats UAHv6, then the globe has been warming at 0.389°C/decade.
So it would seem that, following standard contrarian practices of 1) exaggerating model predictions from CMIP6 and 2) using an incompetent TG dataset, WUWT has managed to make model predictions and temperatures completely agree. Warming is actually (according to WUWT) happening at 0.003°C/decade more rapidly than CMIP6 models. It would also seem that climate scientists and the IPCC have not been alarmist enough. Conventional contrarian conspiracy theories claim that climate scientists are manufacturing global warming. But apparently climate scientists have actually been doing the opposite - they went through the trouble of using a grid to ensure proper weighting of station data, using homogenization to remove non-climatic biases from temperature data, publishing their methods and uncertainty estimates in the peer-reviewed literature for evaluation by others. Those efforts lead climate scientists to say that warming has only been occurring at rates at about 0.2°C/decade for the last 30 years. And these observed warming rates lower than TG's warming rates still have actually agreed quite well with most of the major models published since the 1960s.
But if you scrap all that and just go with Monckton's and TG's fakery, you end up with agreement between models and observations in the realm of alarmism, in the neighborhood of 2x warming rates in competent datasets. Too funny.


Comments
Post a Comment