Posts

Showing posts with the label global temperature

Is There a Global Average Temperature? Part 2

Image
In a previous post I gave my rebuttal to a common objection to climate science that there is no global average temperature (or that it's incalculable or meaningless). At the time I was unaware of a paper published by Essex and McKitrick[1] on the subject, published in 2007 (hereafter EMA07). I've since read it, and while I don't think my previous post needs to change in response to it, I do think it may be worthwhile to update that post with responses specifically tailored to this paper. Others have already responded this paper (it's 18 years old), most notably at RealClimate and Rabett Run , and they do a thorough job of responding to the more technical aspects of this paper. I don't think I can add anything here that you wouldn't be better served reading there, but I do have a couple thoughts about this that I think would be helpful. Averaging Intensive Variables The main argument of this paper appears to be centered on the distinction between two types of v...

2024 Satellite Temperature

Image
The December 2024 data from RSS was just made available, so I thought I'd put together some summary graphs for RSSv4 and UAHv6.1. The 2023-2024 warming spike was more pronounced in satellite data, which is intriguing. But RSS continues to show more warming than UAH.   Here are trends for the full dataset and the last 30 years: 1979 - 2024 Trends UAH: 0.153 ± 0.012°C/decade (2σ) RSS: 0.230 ± 0.012°C/decade (2σ) 1995-2024 Trends UAH: 0.162 ± 0.025°C/decade (2σ) RSS: 0.249 ± 0.024°C/decade (2σ) These trends seem pretty disparate from each other (RSS shows ~50% more rapid warming), and my uncertainty calculation doesn't account for all the sources of error in these datasets. Most importantly (as I share here ), difficulties with satellites beginning around 1998 were resolved in different ways between RSS and UAH. The decisions made by each explain a good portion of the disagreement between them (they can be seen between 1998 and 2004 below), and that is not factored in to the abov...

RIP, Temperature.Global

Image
A few years ago, I began seeing contrarians promoting data from a website called temperature.global (TG), a website that claimed to publish global temperatures. According to their description, TG "calculates the current global temperature of the Earth. It uses unadjusted surface temperatures. The current temperature is the 12M average mean surface temperature over the last 12 months compared against the 30 year mean. New observations are entered each minute and the site is updated accordingly. This site was created by professional meteorologists and climatologists with over 25 years experience in surface weather observations." The website was run anonymously; to my knowledge, nobody knows exactly who is behind it. I corresponded with at least one of the people who ran the website, and he/she used the initials TG for the person's name. In another post I documented some of the failures of the website after seeking clarification from TG. The more I corresponded with TG, th...

Why Do Climate Scientists use 15°C for Current GMST?

Image
There's a conspiracy theory floating around the blogosphere and social media that argues (oddly) that climate scientists manufactured global warming by artificially lowering global temperatures. The "thinking" goes like this. Back in 1896, Svante Arrhenius calculated global mean surface temperature (GMST) to be 15°C. Following this, other scientists confirmed this value for later years. For instance, Hansen is reported to have claimed that value in 1981. The first IPCC report is claimed to confirm it again in 1990. In some incarnations of this conspiracy theory use other sources using 15°C, but the concept is the same. Then, after the so-called "pause" began in 1998, scientists needed another way to manufacture global warming, so they lowered GMST to 14°C so that they could increase it again. If that sounds confusing to you, it should. It doesn't make any sense. But let's unpack what's actually going on. Arrhenius' Calculation in 1896 Svante Arr...

Responding to the CO2 Coalition's "Facts #19, #20, and #28" on Geologic Temperature Changes

Image
CO2 Coalition seems to think it needs to say almost the same thing three times in slightly different ways. In " Fact #19 ," " Fact #20 " and " Fact #28 " they said in various ways that global temperatures have changed a lot across geologic history, and current temperatures are colder than most of geologic history. While these things are generally true, they are also completely irrelevant to whether humans are changing global temperatures through our carbon emissions and whether that is causing harm for human civilization and biodiversity. There are still several misleading things being said in these three "facts," beginning with the choice of graph. CO2 Coalition shows some version of the above graph in all three of these "facts," claiming it comes from "Scotese (2002)." This gives the impression they got this from a scientific paper, but it's not. It's a schematic that Christopher Scotese put on a website over 20 ye...

Responding to the CO2 Coalition's "Facts #17 and #26" on Whether Current Warming is Unprecedented

Image
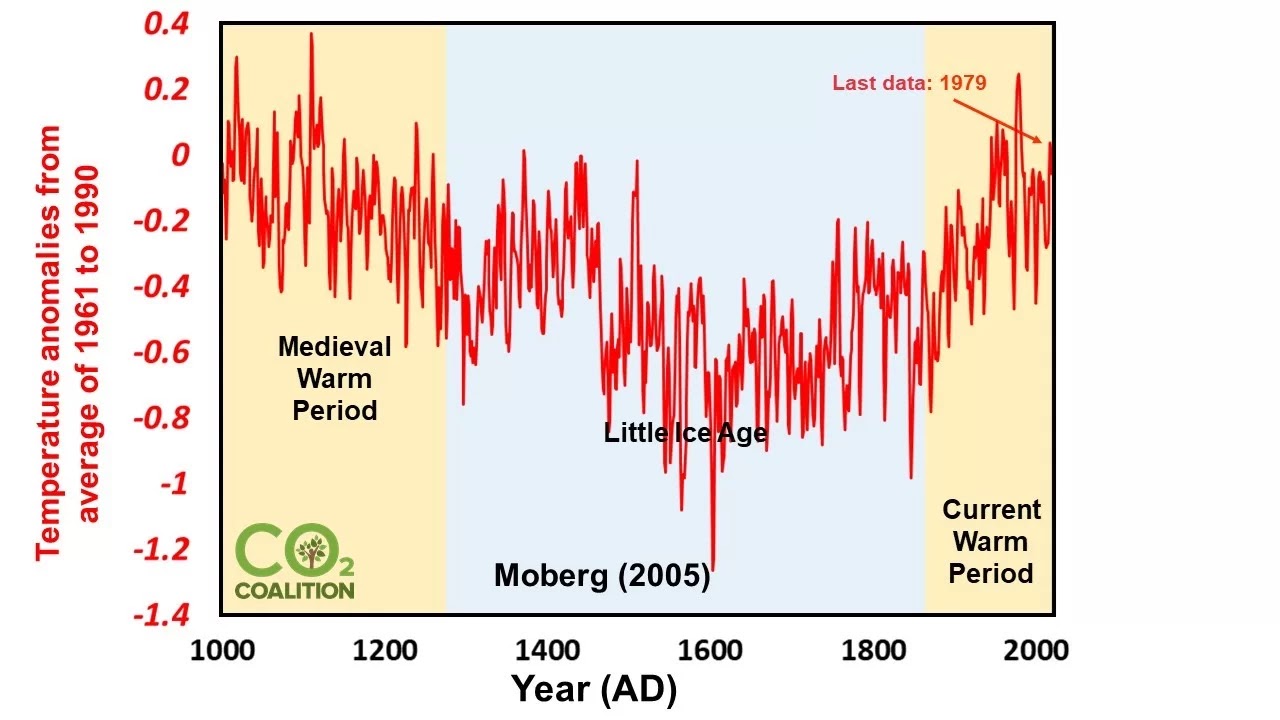
CO2 Coalition 's " Fact #17 " and " Fact #26 " are parts 2 and 3 of an apparent rebuttal of the fact that "current warming" is unusual and "unprecedented" since the beginning of the Holocene. Part 1 (Fact 16) was an attempt to deal with Holocene temperatures. Parts 2 and 3 attempt do deal with temperatures over the last 2000 years, whether using Moberg 2005 (Fact 17)[1] or Loehle 2008 (Fact 26)[2]. I'm including both together here because both of these "facts" have the same fatal flaw - both eliminated "current warming" from their graphs. It should seem pretty obvious to most that you can't show that current warming is neither unusual nor unprecedented over the last 2000 years if you first cut out current warming from consideration. Here's how CO2 Coalition  "hides the incline" in their plot of Moberg 2005. CO2 Coalition says from this that "this chart by Moberg et al is a multi-proxy paleo temp...

Why are Global Temperatures Reported as Anomalies?

Image
For over 100 years, scientists investigating climate change have estimated that the Earth's surface temperature is ~288 K (or ~15°C), which is about 33 K warmer than the Earth's effective temperature of ~255 K (or -18°C). The first paper I know of to use ~15°C as the Earth's "current" temperature is Svante Arrhenius' paper .[1] I've read reports that Fourier did as well but I haven't been able to find where he actually uses this figure. The figure of ~15°C has become somewhat standardized in explanations of the greenhouse effect, with various authors continuing to use the same figure of ~15°C, even as global temperatures rise. Since the sources using this figure are not basing the value on global measurements, I suspect it's best to view it has having an uncertainty of at least ±1°C. Can we do better? Accuracy of Anomalies vs Absolute Temperatures More recently, organizations like NASA have estimated that GMST for their 1951-1980 baseline averaged ...

Is there a Global Average Temperature? Part 1

Image
Update 1/16/2025: I wrote a Part 2 for this post. As I write this, at least two reanalyses are showing what are still preliminary reports of record high temperatures, exceeding the warmest temperatures observed in the instrumental record. If these results hold up to scrutiny over the next couple weeks or so, this will be the hottest week on record. I want to say more about this in a future post, perhaps after the temperatures for these days are confirmed. But events like this sometimes bring out the worst in public debate, with some of extremists on the contrarian side going to the lengths of denying that there is even such a thing as a global average temperature. Now I've become used to reading contrarians claiming that the instrumental record is in some sense unreliable, either because of claims that the data isn't sound or that it's being deliberately corrupted in support of an alarmist narrative. But the outright denial of the concept of a global average temperature...

Debaters Behaving Badly, Part 3 - Confusing Local and Global Temperatures

Image
In my first two posts in this series , I described the bad behavior of cherry-picking short-term trends and choosing the wrong scale to hide the incline of global temperatures. Here I want to consider the trick of using local (or regional) temperatures in place of global temperatures. As best I can tell, there are at least two reasons why people might want to do this. Some people want to say that global warming is good, the world is starved of CO2, and we need to add more CO2 to the atmosphere. Unsurprisingly, two of the most prominent proponents of this tactic are former geologists for the fossil fuel industry. They want to show that societies thrive when global temperatures are warmer. Others using this tactic seem to want to say that global temperatures don't correlate with CO2. And what better way to make that point than to use local temperatures instead of global temperatures? Prepare for some snarkiness.  Using Local Temperatures to Say Global Warming Is Good Imagine you ha...