Posts

Showing posts with the label hadcrut5

Responding to the CO2 Coalition's "Fact #10" on When Modern Warming Began

Image
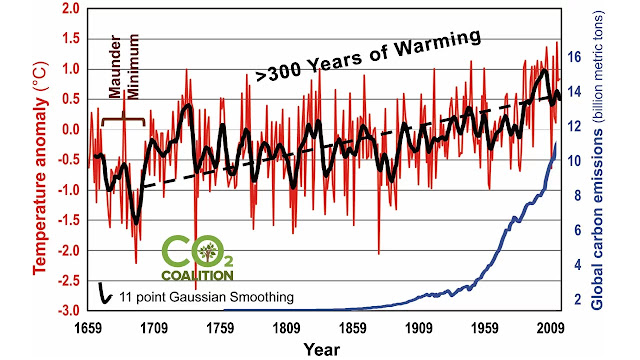
CO2 Coalition 's " Fact #10 " claims that what they call "modern warming" began more than 300 years ago. In their words, "the current warming trend we are in began in the year 1695. The next 40 years had more than twice the rate of warming as we experienced in the 20th century. The first half of this 300-plus year warming had about the same amount of temperature rise as the latter half and was entirely naturally driven." The graph they use to support this claim is below. You may be noticing some recurring themes in the CO2 Coalition bag of tricks - in this case, to use local temperatures in place of global temperatures. They use Central England Temperatures (HadCET) instead of GMST datasets (either proxies or the instrumental record).  HadCET isn't terribly reliable even for Central England during the early years of the dataset, and especially prior to 1772.[1] But data quality issues aside, Central England isn't and never has been the globe. T...

When Will We Cross IPCC Targets?

Image
Recently NOAA released v. 5.1 of their global GMST dataset and, aside from adding full global coverage, it extended the dataset back to 1850. This gives us a third GMST dataset that goes back to 1850. Since the IPCC uses the 1850-1900 mean as a baseline to represent "preindustrial" temperatures, this gives us three datasets to use to calculate the amount of warming we've experienced above preindustrial levels. The IPCC has set a target of +1.5°C above preindustrial temperatures, where +1.5°C is a 30-year average above the 1850-1900 mean. The IPCC estimates that 2011-2020 averaged +1.1°C above preindustrial levels. But the question I have is, where are we now, and when will we cross the +1.5°C and +2.0°C targets if we continue warming at current rates? To answer this question, I took the data I've already downloaded from NOAA (monthly), HadCRUT5 (monthly) and Berkeley Earth (annual). The NOAA dataset is current through January 2023 and the other two are current through...

How Do Cumulative Carbon Emissions Affect Warming?

Image
The IPCC (and others) have observed that there has been a near linear increase in GMST with cumulative anthropogenic carbon emissions. "In the literature, units of °C per 1000 PgC (petagrams of carbon) are used, and the AR6 reports the TCRE likely range as 1.0°C to 2.3°C per 1000 PgC in the underlying report, with a best estimate of 1.65°C."[1] To be clear, 1000 PgC = 1000 GtC = 1 TtC.  I decided to see if that has been observed in the empirical data. I took values from the 2021 global carbon budget [2] and HadCRUT5 set to a 1850-1900 baseline and plotted the relationship. The R^2 was 0.88, and the slope of the best fit line was 1.847 ± 0.104°C/TtC (2σ). So the 95% likely range is between 1.74 to 1.95 C/TtC from 1850-2021. If I start after we reach 200 GtC in 1951, the best fit line is 2.153 ± 0.176°C/TtC (2σ) and the R^2 increases to 0.90, but I think it's best to be conservative here. What this suggests to me is that the IPCC may again be a bit conservative their best e...

Plotting Temperature with CO2

Image
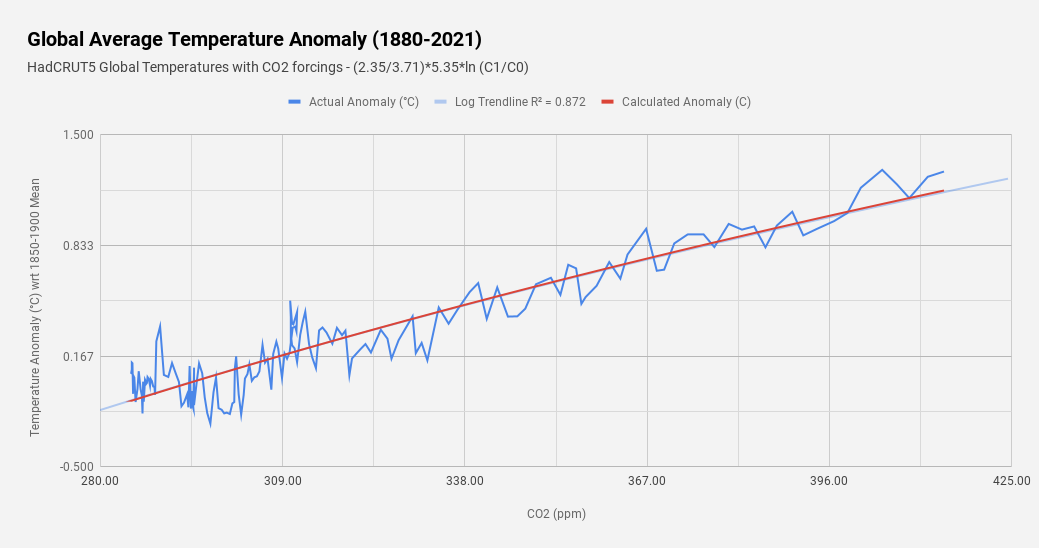
The Best-Fit Trend assumes a "Sensitivity" of 2.35 C I decided to have a bit of fun playing around with CO2 and global temperature data. I downloaded CO2 concentration values from 1850 to 2021 as well as HadCRUT5 annual data, which I set to a 1850-1900 baseline, for the same time frame. I put both into a Google Sheets spreadsheet. I then calculated the expected change in temperature from the 1850-1900 mean using the formula: dT = (S/F2x)*ln (C1/C0), where dT = Change in temperature (C) S = A sensitivity value. F2x = The forcing for doubling CO2 (3.71 W/m^2) C1 = CO2 in any given year (ppm) C0 = Preindustrial CO2 (280 ppm) I then plotted both the actual temp anomaly and my calculated anomaly with CO2 on the X-axis, then had my spreadsheet draw a logarithmic trend through the actual temperature data. Then I chose an S value that matched that logarithmic trend, and I came up with 2.35 C. It occurs to me that this value is too small for ECS, since this doesn't account for the...