Responding to the CO2 Coalition's "Fact #10" on When Modern Warming Began
CO2 Coalition's "Fact #10" claims that what they call "modern warming" began more than 300 years ago. In their words, "the current warming trend we are in began in the year 1695. The next 40 years had more than twice the rate of warming as we experienced in the 20th century. The first half of this 300-plus year warming had about the same amount of temperature rise as the latter half and was entirely naturally driven." The graph they use to support this claim is below.
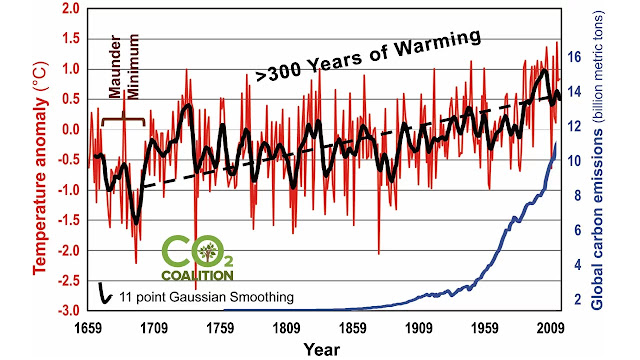 You may be noticing some recurring themes in the CO2 Coalition bag of tricks - in this case, to use local temperatures in place of global temperatures. They use Central England Temperatures (HadCET) instead of GMST datasets (either proxies or the instrumental record). HadCET isn't terribly reliable even for Central England during the early years of the dataset, and especially prior to 1772.[1] But data quality issues aside, Central England isn't and never has been the globe.

The instrumental record is pretty sparse globally before 1850, the end of the Little Ice Age (LIA). However, one thing we can say is that trends during the years between 1850 and 1900 were essentially flat. I calculated the trend with uncertainty for the three GMST datasets that cover 1850-1900:
HadCRUT5: -0.012 ± 0.023°C/decade (2σ)
Berkeley Earth: 0.011 ± 0.028°C/decade (2σ)
NOAA: -0.006 ± 0.019°C/decade (2σ)
%20(1).png) The above graph shows a log fit with global temperatures with an r^2 of 0.88, meaning that CO2 levels are a very good predictor of global temperatures since 1850. If you plot the same graph with radiative forcing instead of CO2 concentrations (see here), slope of this correlation is 0.632 C/Wm^2, which corresponds to a TCR of 0.632*3.71 = 2.3 C, though this assumes that other forcings are negligible.
The above graph shows a log fit with global temperatures with an r^2 of 0.88, meaning that CO2 levels are a very good predictor of global temperatures since 1850. If you plot the same graph with radiative forcing instead of CO2 concentrations (see here), slope of this correlation is 0.632 C/Wm^2, which corresponds to a TCR of 0.632*3.71 = 2.3 C, though this assumes that other forcings are negligible.
[1] Parker, D. E., T. P. Legg, and C. K. Folland, 1992: A new daily Central England Temperature Series, 1772-1991. Int J Climatol, 12, 317-342.
Berkeley Earth: 0.011 ± 0.028°C/decade (2σ)
NOAA: -0.006 ± 0.019°C/decade (2σ)
As you can see, there was essentially no warming for 50 years following the end of the LIA in 1850 The sign of the trend is not even consistent across datasets. Global temperatures began to increase and accelerate with our GHG emissions. In fact, the correlation between CO2 and GMST is quite high, meaning that CO2 is a very good predictor of global temperatures. And yes, I know that correlation does not equal causation, but causation has been established elsewhere. Here I think it's fair to say that human activity (GHG emissions partially masked by aerosols) does a very good job of explaining current warming.
%20(1).png)
References:


Comments
Post a Comment