Posts

Showing posts from January, 2023

2022 Global Mean Surface Temperatures

Image
GMST Anomalies (1850-2022) Data for global mean temperatures from 2022 have come in, and depending on the dataset, 2022 was either the 5th or 6th warmest year on record - some say 2015 was cooler, and some warmer. The following graph from Zeke Hausfather shows how GMST stacks up with recent years in the BEST dataset. BEST Anomaly Ranking   2022 was also the warmest La Niña year on record, despite being a stronger La Niña year than 2018 and 2021. The following is the list of anomalies, all set to deviations from the 1951-1980 mean. Where I was able to find them quickly, I included the 95% CIs for each anomaly. Dataset Anomaly ( º C) (1951-1980) HadCRUT5 NASA NOAA BEST JMA NCAR* ERA5* Average 0.878  ± 0.036 0.893   ± 0.05 0.820   ± 0.15 0.929   ± 0.028 0.785 0.865 0.921 0.861 *Reanalysis The average for all of these was 0.86 C warmer than the 1891-1980 mean. Thirty year trends have been accelerating, recently increasing beyond 0.2ºC/decade. With three La Niña events, though, acceleration

Hansen on Global Warming in the Pipeline

Image
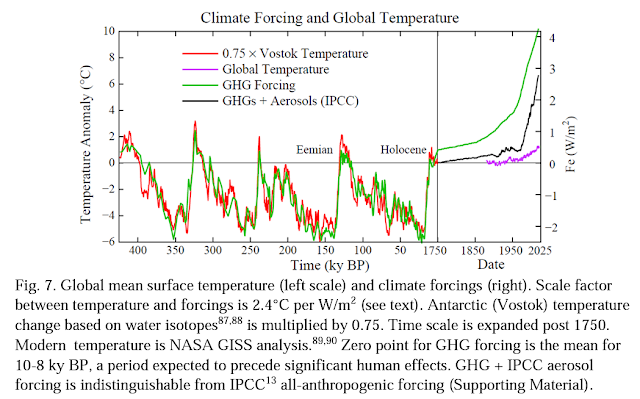
A paper is currently sitting on the ArXiv[1] awaiting publication that has garnered a fair amount of attention on social media. It's a paper by Hansen with several other well-respected and influential scientists. Since this paper is currently in prepublication, and I don't know what this paper will be like when it's published, I don't want to make too much of this, but it is very interesting, if alarming. At best, I see this as an upper bound estimate of how bad AGW could become long-term. I'd like to consider what this paper (in it's current form) is suggesting and evaluate what it claims. Summary of Hansen's Paper The general thrust of this paper is that paleoclimate evidence shows that fast feedback sensitivity (ECS) is 3.5 - 5.5°C and GHG forcings are are 4.1 W/m^2. After slow feedbacks bring the Earth's climate system into full equilibrium with these forcings (what is called Earth System Sensitivity), we can expect about 7-10°C warming long term fro

No, All Plantlife Doesn't Die at 150 ppm CO2

Image
Frequently I'm told that the increase in CO2 from fossil fuel emissions is good for the planet because, before the industrial revolution, CO2 levels were dangerously low. Gregory Wrightstone, for instance, claims that "before we began adding CO2 to the atmosphere, we weren’t sure that we wouldn’t cross that critical 150-ppm threshold during the next glacial period" when nearly all "terrestrial plant life cannot exist." According to him, "advanced plant life could not survive without at least 150 ppm" CO2. He calls this a "line of death." [1] I've even read people claiming that currently the atmosphere is "starved" of CO2. It's hard to know where this 150 ppm value originates; I haven't been been able to find it anywhere in the scientific literature, but I did read once that in greenhouses, daytime photosynthesis can lower CO2 concentrations to about 150 ppm. However, that does not justify any conclusion that plants canno

Does CO2 Saturation Mean No More Warming Can Happen from Increasing CO2?

Image
I sometimes hear that increasing CO2 concentrations cannot cause any more warming because the atmosphere is already saturated with CO2. The idea being promoted is that the CO2 in the atmosphere already traps all the heat it can possibly trap, so adding more CO2 can't trap any more heat. The thought appears to be that the atmosphere is like a saturated sponge. Pouring more water onto the sponge can't add more water too the sponge; water must leave the sponge at the same rate water is added. But this analogy has little do do with the actual physics of how increasing CO2 warms the surface . CO2 warms the Earth's surface because solar energy entering the earth's climate system is absorbed by the earth's surfaced and is radiated back as IR light (heat). CO2 absorbs IR light at 15 μm and then emits it in all directions. Some of that IR light is sent back to the earth. The more CO2 in the atmosphere, the more IR light is absorbed and emitted towards the surface of the eart

Is the Sun Responsible for Recent Warming?

Image
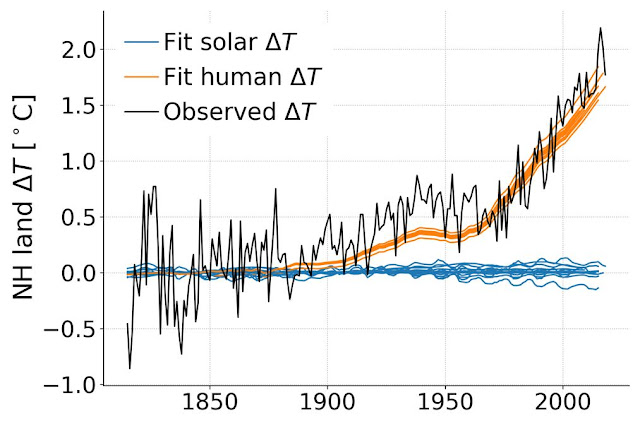
In a previous post , I pointed out that I find the notion of quantifying "consensus" to have limited value, but one value I admit it can have is to show areas of climate science about which practicing scientists no longer in actively debate in the literature. This allows us to understand what debates in popular discourse do not translate into debate among climate scientists. One of the most common objections to AGW I hear in popular circles is that warming is caused by the Sun, rather than human activity. The most common way I see this claim is with reference to solar variability in terms of total solar irradiance (TSI). Variability in TSI can be caused by two things: changes in solar output, like the 11-year solar cycle, or changes in the distance between the earth and the Sun. Variability in the Earth's orbit around the Sun, often referred to as orbital cycles, do not change the total amount of energy the Earth receives in a year, but they can change the distribution of

The Long-Term Effects of CO2 on Global Mean Sea Levels

Image
Paleoclimate studies offer some very useful information to help scientists understand where our climate is headed given our current concentrations of greenhouse gases. As I have shared in previous posts, the earth has warmed by 1.2°C above the 1850-1900 mean, with about 2°C total warming built into current CO2 levels, given an energy imbalance exceeding 0.8 W/m^2 and ECS of ~3°C for doubling CO2. However, this only considers rapid feedbacks operating on time scales of decades or so. Long term, over time scales of thousands of years, the Earth's climate system is sensitive enough to these forcings to cause drastic changes to the climate system. Earth System Sensitivity (ESS) is frequently estimated to be about 1.5xECS, so 2°C warming on time scales of decades will be amplified to 3°C warming on time scales of thousands of years.  The difference between the last glacial maximum (LGM) and the Holocene Thermal Maximum (HTM) is only ~4-6°C, but that difference in global average temperat

Acceleration in Sea Level Rise

Image
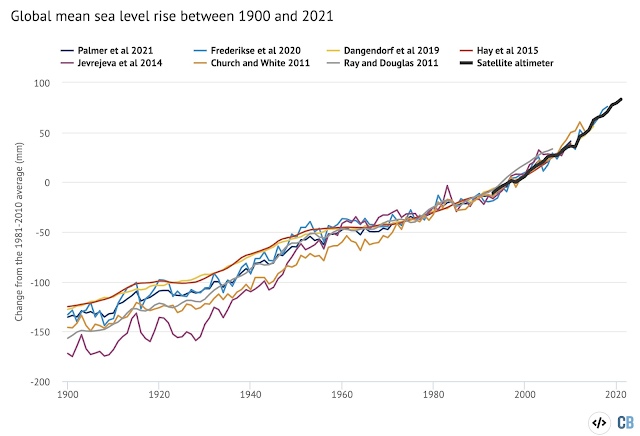
Sea Level Rise Since 1900 Humans have been very concerned with sea levels for centuries, since understanding tides and sea levels has been important for maritime travel, fishing, and many other aspects of coastal living, including recreation. We have built tide gauges to monitor sea levels, giving us a long-term record of sea levels along our coasts that can now be used for measuring sea level rise (SLR) in response to climate change. As scientists have become more interested in paleo climates, they have also developed reliable means of estimating sea levels going back thousands of years. Both of these methods, proxies and tide gauges, are generally limited to estimating sea levels along our coastlines, but in early 1990s, scientists developed a means to use satellites to estimate sea levels, and this approach for the first time allowed scientists to estimate global mean sea level (GMSL) from most of the surface of the oceans, rather than just our coastlines. Each of these lines of evi