Posts

Showing posts from 2021

The Younger Dryas and Abrupt Climate Changes

Image
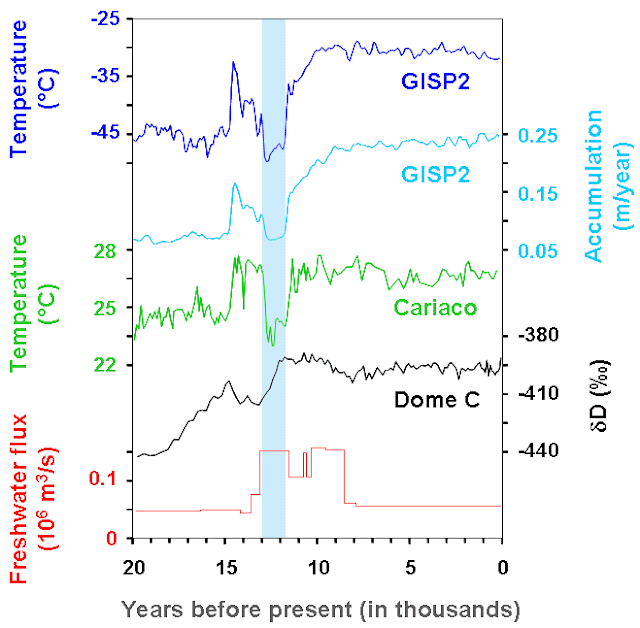
We are often conditioned to think climate changes that occur naturally are always slow and gradual. However, the geologic evidence we have shows that there major exceptions to this general rule. Perhaps the most widely-cited is the onset of the Younger Dryas - a well known abrupt climate change in which temperatures changed rapidly, perhaps by 10°C in a few decades, with completely natural causes. The episode is most easily identified in the GISP2 Greenland ice core record. According to the ice core record, cooling began about 14,500 years ago, followed by an abrupt cooling event about 13,000 years ago. That cooling period ended just as abruptly 11,500 year ago, and recovery from the last glaciation continued into the Holocene. Abrupt shifts in temperatures in agreement with these time frames were also seen in other places around the globe, including the Cariaco Basin in Venezuela and varved lake sediments in Europe. This raises a couple interesting questions: 1) what caused the abrupt

Why Are Reconstructions of Global Temperatures Hockey Stick Shaped?

Image
Pages 2K Global Temperature Reconstruction In 1998 and 1999, Dr. Michael Mann published two studies reconstructing Northern Hemisphere and global temperatures. The studies reconstructed these temperatures using various proxies from around the globe to estimate how temperatures have changed over time. The results for some were shocking. Temperatures had been in a slow but steady decline since about a.d. 1000, and then around the beginning of the 20th Century, temperatures began to rapidly rise, exceeding anything seen in the last millennium. Later reconstructions have improved upon Mann's work, extending the proxy record farther back in history and developing more extensive use of proxies for more coverage of the globe. This later work has largely replicated Mann's work, and the "hockey stick" shape to global temperatures is now well-established in climate science. By one count, Mann's findings have been replicated no less than 50 times in the scientific literature

Quantifying Cloud Feedbacks for Climate Sensitivity

Image
One of the more challenging aspects of climate science today is quantifying the cloud feedbacks to better constrain estimates for equilibrium climate sensitivity (ECS). It’s long been understood that low clouds generally have a cooling influence, while higher clouds increase warming via the greenhouse effect. Previous attempts at quantifying the net feedback have produced results where the confidence interval is larger than the estimate. For instance, Andrew Dessler’s estimates[1][2] were +0.50 ± 0.75 W/m^2/K over a 10 year period. Zhou’s estimate[3] was −0.16 ±0.83 W/m^2/K. Attempts at simulating clouds in some of the CMIP6 models have produced ECS values that are likely too high,[4] though many of these issues have since been largely resolved.[5][6][7]. A new study,[8] however, has succeeded at quantifying these cloud feedbacks at 0.43 ± 0.35 W/m^2/K. This means that for every 1 C warming, we can expect an additional 0.43 W/m^2, amplifying warming. Given these results, there is just

A Survey of Scientific Literature on CO2 and Paleoclimate

Image
Reconstructed Temperatures (Top), Modeled CO2 (Bottom) and Glaciation (Blue) My interest in climate science came from my background in geology, which lead to an interest in paleoclimates, which then lead to better understanding more recent climate changes. I thought it might be interesting to share some of the more recent studies examining the correlation between CO2 and global temperature over the course of the 21st century so far. The tl;dr is simply this: there is a robust correlation between modeled and proxy evidence for CO2 and both reconstructed temperatures and evidence for glaciation across the Phanerozoic. In 2001, Robert Berner constructed a climate model to “predict” CO2 levels throughout the Phanerozoic.[1] In that paper, he also provided the proxy data for CO2 during the last 420 years or so. He was able to demonstrate that lower levels of CO2 correspond to periods of glaciation, and high CO2 levels correspond to periods with no glaciation. GEOCARBIII Climate Model CO2 Re

Solar and CO2 Forcings for the Last 420 Million Years

Image
One of the most interesting papers[1] I’ve seen in the last few years looks at future of climate forcing compared to the last 420 million years of geologic history. The study compiled CO2 proxy data for the last 420 million years from “1,241 independent estimates coming from five proxy methods and 112 published studies.” The resulting CO2 timeline is expressed both in terms of absolute concentrations and radiative forcing, accounting for both CO2 and the steady increase of solar output over time. The resulting timeline was then compared to the “representative concentration pathways” for future CO2 emissions. Under the “business as usual” RCP 8.5, “fossil fuel emissions suggest that atmospheric CO2 could peak in 2,250 AD at ∼2,000 p.p.m.” This would produce CO2 levels similar to the latter half of the Triassic (220-200 million years ago). However, given the increase in solar output, the radiative forcing this would produce would be similar to the early Eocene, likely exceeding the geolo

Is a Taxonomy of Climate Misinformation Helpful?

Image
A paper was just recently published in Nature Scientific Reports[1] that classifies the types of climate misinformation promoted by conservative think tanks (CTTs) and contrarian blogs (CBs). The taxonomy includes 5 major “super claims” with “sub-claims” and “sub-sub-claims” within the larger categories. The 5 “super claims” are: 1. Global warming is not happening 2. Human Greenhouse gases are not causing global warming 3. Climate impacts are not bad 4. Climate solutions won’t work 5. Climate science is unreliable The sub- and sub-sub- claims are positions used to justify the larger “super” claims. It’s important to note that some of these may be truthful claims, but they are used inappropriately to justify the false “super claim.” For instance, “we need energy” (4.5) is true, but it serves as a subcategory of claims used to justify the claim that climate solutions won’t work. Likewise, “nuclear is good” (4.5.3) is a position that is held by many people who are otherwise not contrarian

Tony Heller Resources

Image
I value the right of free speech that we have in the United States, and it's a value that I cherish. Yet it is pretty much inarguable that one consequence of free speech is that obvious and deliberate misinformation and disinformation need to be protected along with truthful information. While there are limitations on our free speech (like laws against defamation), our current system even protects people against libel and slander lawsuits if the person making these claims is not credible enough to be taken seriously by rational people (a tactic used by Tim Ball to escape libel damages).  We can have whatever opinions we want, regardless how wrong they are or how insincere they are, and we can publicly advertise those opinions for others to read.  The internet and social media has made it easier for people to advertise and promote those opinions to wider audiences, and technology has progressed to the point where many of these people can produce quality-looking content. So misinform

CO2 Lag and Causation in the Quaternary Glacial Cycles

Image
The View from Wesser Bald Nantahala National Forest, North Carolina Considerable research has been given to understanding the processes by which climate has changed to produce the glacial-interglacial cycles. Two studies have examined how climate warmed from the Last Glacial Maximum (LGM) to the Holocene Thermal Maximum (HTM). Shakun et al 2012[1] examined proxies from around the globe to construct a timeline of how and when warming occurred. Beginning with the LGM, the Milankovitch Cycles triggered a global warming of about 0.3 C. This initial warming caused CO2 to degas from the oceans about 17,500 years ago. CO2 in this case doesn’t cause the initial warming; it is a feedback that amplifies warming. “This early global warming occurs in two phases: a gradual increase between 21.5 and 19 kyr ago followed by a somewhat steeper increase between 19 and 17.5 kyr ago (Fig. 2a). The first increase is associated with mean warming of the northern mid to high latitudes, most prominently in Gre

Making Sense of the Mid-Pleistocene Transition (MPT)

Image
I recently read a fascinating study looking to understand why the “Mid-Pleistocene Transition” (MPT) happened about 1 million years ago. The MPT refers to the change where the glacial-interglacial cycles of the Pleistocene (the last 2.6 million years) changed from cycles of ~41,000 years to ~100,000 years. Both periodicities are synced to Milankovitch Cycles. During the early Pleistocene, the periodicity matches cycles in the earth’s obliquity, but after the MPT the glacial-interglacial cycles began to track more closely with variations in the earth’s orbital eccentricity. So the big question has been why the change? A recent paper by Willeit published in Science Advances [1] examined this by producing a model that was able to reproduce the MPT. In fact it accurately reproduced the maximum extent of the ice sheets as well as extent of sea level rise. It made use of the carbon cycle, volcanic activity, and changes in regolith cover. The model results indicate that continents had built u

Tony Heller and the Fabrication of History

Image
From Garavaglia et al 2012 Sociologically speaking, Tony Heller is a fascinating person. I mean, he's ridiculous, but in debate groups, it's not uncommon to see people defending his claims despite incontrovertible evidence that he's wrong. Some of this may have to do with his rhetoric. He begins every video he makes informing you that he's the sole authority on climate, and in almost every video he at some point will refer to climate scientists as liars, frauds, and criminals. In a recent video, though, he decided to take this a step further and start mocking random people on Twitter for being sad about the retreat of mountain glaciers. This was based on a news story by CNN reporting that WWI artifacts were found in a cave in Northern Italy. Climate change has recently made it possible to enter that cave and discover these artifacts. Heller imagined that the reason why that cave was able to be used during WWI was because the was no ice there then. After WWI, we're t

What is the Effect of Urban Heat Islands on Global Warming Trends?

Image
Baltimore's Inner Harbor It is well-documented that cities are significantly warmer than rural areas. This effect is commonly described as an urban heat island (UHI). Some argue that some (or all) of the increase in global temperatures can be explained by the effect of the UHI effect on global temperatures. It makes some intuitive sense that this might be the case, but let's consider some important lines of evidence that suggest otherwise. First, while urban areas are warmer than rural areas, urban areas are warming at about the same rate as rural areas, so temperature anomalies are not significantly affected by urban heat islands.[1] Second, there is a well-documented bias that can be added to the temperature record from urbanization. As a rural area becomes more urban, it will warm at a faster rate than cities and rural areas. An area that is rural in 1950 but urban in 2020 will become progressively hotter due to urbanization, and not changing climatic conditions. However, nu

How Much CO2 have Human Activities Added to the Atmosphere Since the Industrial Revolution?

Image
Little Big Econ State Forest One objection I frequently hear to climate science is that the human contribution to the increase in CO2 concentrations is small, so reducing our carbon emissions will have little to no effect on global temperatures. This claim is completely misguided, and calculations using estimates of human carbon emissions can settle this pretty quickly. The following calculations are through 2018, with CO2 levels at 410 ppm, about 130 ppm higher than pre-industrial 280 pm. We can provide a rough estimate of how much of the 410 ppm is human by looking at empirical data regarding anthropogenic CO2 emissions  and a couple conversion factors:[1] 3.67GtC = 1 GtCO2  1 ppm CO2 = 7.81 GtCO2. According to the global carbon budget through 2018, humans have emitted 441 GtC through fossil fuel use and 203 GtC through land use, for a total of 604 GtC anthropogenic emissions.[2] That translates to 2217 Gt CO2 emissions. About 50% of that amount stays in the atmosphere. So: 2217 GtCO

A Calculation for Equilibrium Climate Sensitivity (ECS)

Image
Tree Overhanging the Econ River, Little Big Econ State Forest, May 9, 2021 My interest in "wood romances" spans the gamut from nature photography to hiking, to conservation, to understanding the future impacts of climate change. I frequently participate in on-line discussions on these matters, and many of the same issues get recycled in numerous contexts. I've taken to addressing these in relatively short responses so that I don't have to rewrite the same arguments, evidence and calculations. Here is a basic calculation of equilibrium sensitivity (ECS) that I did recently. ECS is the amount of increase in global mean surface temperature (GMST) after reaching equilibrium with a doubling of CO2 concentrations. There are many ways to do this, and this is a simple energy balance equation that uses empirical data for various forcings to arrive at the estimate. This of course is not the end of discussion on the matter. Many scientific studies have been written estimating t