Posts

Showing posts with the label pages 2k

Wielicki is Now Using AI-Generated Slop Memes

Image
It looks like Wielicki is now generating and/or promoting AI-generated memes that misrepresent climate science . I saw this from him on X earlier today  (an alternate version from him is  here ). AI-generated Meme from Wielicki Wielicki's meme misrepresents and/or fabricates multiple lines of evidence. Let's look look at each of these supposed lines of evidence to see if he's made his case that "Natural variability produced temperatures like these before, so we should expect it to contribute to temperatures like these again... regardless of CO₂." Temperature Stripes The climate stripes in Wielicki's meme is attributed to BĂ¼ntgen et al 2020 [1]. This paper was explicitly not limited to Europe. It included extratropical NH temperatures with distinct treatments for Eurasia (EA) and Eurasia/North Atlantic (EA+), and even the EA reconstruction is significantly larger than Europe. The paper is intended both 1) to parse out the role of volcanic forcings during th...

Some Notable Hockey Stick Reconstructions

Image
 For fun I've been collecting hockey sticks. The following are not complete, but I think they're pretty representative. In fact, I even collected the much maligned Loehle 2008 reconstruction, which has been the darling of contrarian "science." There are numerous issues with that reconstruction, which I document here , but I'm including it because doing so doesn't change the fact that all known temperature reconstructions covering anywhere from NH-extratropical temperatures to global mean temperatures have a hockey stick shape if you include the 21st century. I decided to break this up into three graphs, one showing GMST reconstructions, one showing NH and NH-extratropical reconstructions, and one showing NH-summer and/or NH-growing season reconstructions. I'm showing each with their respective instrumental counterparts (global, NH, and NH-summer). For reconstructions with annual resolution, those are shown faded, but I show running 10-year means for all of...

Debaters Behaving Badly, Part 4 - Inaccurately Comparing Datasets

Image
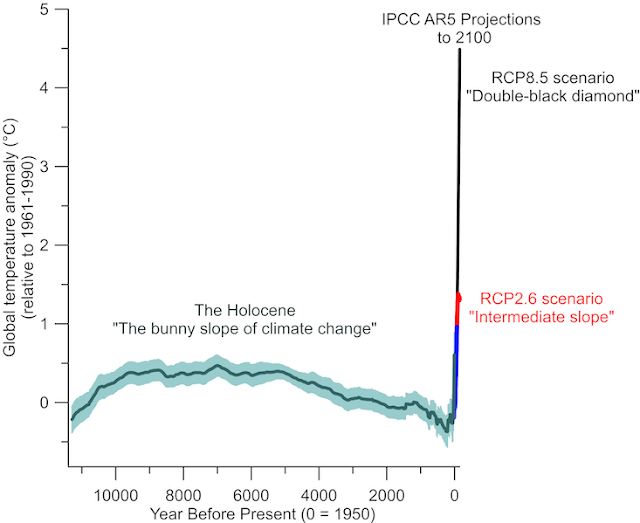
In previous posts in this series , I've tried summarize what I consider bad behavior among those debating climate change. So far I've discussing what I consider statistically unethical practices - using short-term trends, misusing scales, and using local instead of global data. Here I'd like to look how we make comparisons between types of data. In climate science, we need to deal with all sorts of different kinds of data. For global temperatures, I can think of at least 3 - proxies, the instrumental record (satellites, thermometers), and models (reanalysis, modeled projections, etc). It's perfectly fine to create graphs that include all of these kinds of data, but in doing so, we have to make sure that we are communicating honestly and making comparisons accurately. Proxy data has lower resolution and larger confidence intervals than the instrumental record, and modeled projections always depend in part on the assumed scenario, and confidence intervals for these projec...