Posts

Showing posts from September, 2022

Review of Inconvenient Facts, Part 2 - Temperature

Image
Pages 2K Reconstruction of Global Temperatures Replicating MBH98/99 In a previous post , I wrote an initial review of Gregory Wrightstone's Book, Inconvenient Facts. We began to see that Mr. Wrightstone's book was pretty low on facts and high on convenience - that is, Wrightstone's claims would be very convenient for us if we believe him, since if there is no problem, we have no compelling reason to fix a non-existent problem. That post covered only the first two chapters of his book. Chapter 3 is supposed to contain more inconvenient facts about temperature, but what we get is a lot of misinformation about temperature based on 1) the rejection of scientific evidence about temperature and 2) the confusion of global temperatures with local temperatures, including 2a) Central England and 2b) the Greenland summit, and 3) the misuse of a terrible proxy reconstruction. Confusion About Proxies Mr. Wrightstone (somewhat) correctly observes that, if global (or Northern Hemisphere)

How Do We Know We're Responsible for all the Postindustrial Increase in CO2 Concentrations?

Image
Sometimes I still hear objections to AGW that claim that humans could not be causing the atmosphere to warm because our emissions constitute only a tiny fraction of the CO2 that's in the atmosphere. There are several forms of this claim, but most have to do with the fact that human CO2 emissions are a small fraction of total emissions every year, which of course is true. What they don't tell you is that natural sinks remove what natural sources add each year, and a little more, making the natural carbon cycle a net sink. So while human emissions are small compared to natural, they are responsible for flipping the carbon cycle from being a net sink to a net source of CO2. Human activity is responsible for virtually all the increase in CO2 above preindustrial levels. The graph below shows various components of the carbon cycle with averages for 2011-2020. Here the natural carbon cycle removes about 5.9 GtC annually, while human emissions from fossil fuels and land use change cont

Commenting on a Comment by Happer and Lindzen

Image
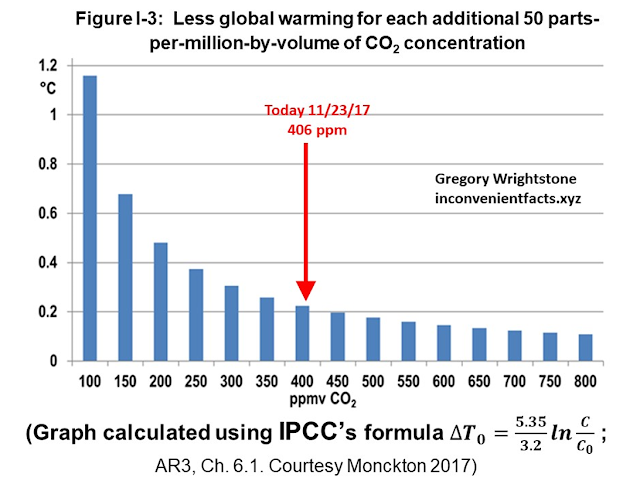
Recently I came across a document reportedly written by William Happer and Richard Lindzen (HL) entitled Comment and Declaration on the SEC’s Proposed Rule “The Enhancement and Standardization of Climate-Related Disclosures for Investors,” File No. S7-10-22, 87 Fed. Reg. 21334 (April 11,2022).[1] As I read through the science-related material in the document, it became quickly apparent to me that his document is utter garbage. It's so bad, I wonder to what extent either of them actually wrote it. Rather than go through the document section by section, I want to just analyze the section on climate sensitivity. What we'll see here is that the paper is inconsistent with itself, it contradicts the other published works of the authors, and of course, it's demonstrably false. Internal Inconsistencies The section I'd like to discuss primarily is section II.M, with the brief title, "The Logarithmic Forcing from CO2 Means that Its Contributions to Global Warming is Heavil

Observational Evidence for the Greenhouse Effect

Image
In a previous post I looked at evidence of the greenhouse effect from empirical data. In short, an analysis of empirical data for CO2 and GMST shows a one-way causation with CO2 causing warming since the mid-twentieth century. This paper conclusively establishes causation from empirical time series of CO2 and temperature. That is, not only is CO2 a good predictor of temperature, but  uncertainty is reduced in future values of temperature given past values of CO2. This evidence is conclusive, but  even without this, we have observational evidence for the greenhouse effect. In this post I want to consider how this is true generally in satellite observations of earth's emission spectrum at the top of the atmosphere and in individual studies that have made observational determinations of the greenhouse effect. General Observations The graph above quite literally shows the greenhouse effect. This can be readily determined, but we need to begin by calculating the effective temperature o

Was There a "Mike's Nature Trick" to "Hide the Decline?" Part 1 - Misreading CRU Emails

Image
In November 2009, someone likely stole[1] and publicly released over 1,000 emails from Climate Research Unit (CRU) at the University of East Anglia. Following this, people combed through all these emails  looking for evidence of frauds and coverups. They found very little damaging information, but not everything they found was was good. There were, as best I can tell, four categories of content that were discovered: The normal kinds of communication you'd expect to find in correspondence between scientists Words and phrases that were twisted and contorted to support an imagined conspiracy that had been imposed on the emails. Evidence of mean-spirited attacks on contrarian scientists and heavy-handed tactics intended to punish journals that published contrarian studies.  A single email describing the process of creating a graph for a WMO statement that used the phrase "hide the decline."  What I want to do here is tackle the "hide the decline" email, since of all