Humans have been very concerned with sea levels for centuries, since understanding tides and sea levels has been important for maritime travel, fishing, and many other aspects of coastal living, including recreation. We have built tide gauges to monitor sea levels, giving us a long-term record of sea levels along our coasts that can now be used for measuring sea level rise (SLR) in response to climate change. As scientists have become more interested in paleo climates, they have also developed reliable means of estimating sea levels going back thousands of years. Both of these methods, proxies and tide gauges, are generally limited to estimating sea levels along our coastlines, but in early 1990s, scientists developed a means to use satellites to estimate sea levels, and this approach for the first time allowed scientists to estimate global mean sea level (GMSL) from most of the surface of the oceans, rather than just our coastlines. Each of these lines of evidence tells a compelling story. Sea levels had been variable over the last several thousand years, but around the mid to late 20th century, sea level rise began to increase beyond the range of natural variability and accelerate in response to global warming.
What I'd like to do is briefly summarize the extensive evidence documenting this, along with studies replicating these findings. Then I'd like to consider the significance of accelerating SLR is for us today. With almost all the studies represented here, I've included a quote from the study summarizing its findings in the footnotes.
Paleoclimate Evidence
Sea levels have been rising since the Last Glacial Maximum (LGM) through the Holocene Thermal Maximum (HRM). When we started coming out of the LGM, there were thick ice sheets covering most of Canada and Europe, even extending into the mid-latitudes of the United States. As the climate warmed, sea levels rose sometimes reaching astonishing rates of SLR because, even though the globe was cooler, and warming rates were slower, there was simply a lot of ice on the planet to melt.[1]

The rapid increase in sea levels was punctuated by several meltwater pulses that indicate either a rapid collapse of an ice sheet or the draining of an inland lake. There is some evidence that the Younger Dryas may have been caused by one of these pulses. The Holocene began 11,700 years ago, at the end of the Younger Dryas, when global temperatures began to stabilize. But sea levels continued to rapidly rise until about 7,000 years ago, when sea level rise dramatically slowed. Over the last 7,000 years, sea levels increased by perhaps about 2 m or so. The surface area covered by glacial ice was approaching equilibrium with global temperatures, but it took several thousand years of stable temperatures for this to happen.

The above reconstructions are relatively coarse estimates compared to what scientists can ascertain from tide gauges and satellite measurements. But in 2016, Robert Kopp published a study[2] reconstructing sea level variability over approximately the last 3000 years with more resolution. His analysis combined regional reconstructions of sea levels into a reconstruction of GMSL. His analysis showed that GMSL varied by about ±8 cm over the preindustrial common era, and the highest levels were between 1000 and 1400 CE. Sea levels then dropped with about ∼0.2 °C global cooling entering into the Little Ice Age, but following the LIA, we have experienced ~14 cm of SLR, making current SLR rates unique over the study period. Kopp also estimates that without global warming, the earth would have experienced anywhere between a 3 cm drop in GMSL to a 7 cm increase in GMSL, so AGW has at least doubled the amount of SLR we would have experienced otherwise.

The above graph shows general agreement between the global temperature reconstructions of Mann and Marcott with Kopp's reconstruction of GMSL along with the expected SLR under various RCP scenarios through 2100. These projections indicate that we will experience about 80 cm (2.6 ft) of SLR by 2100.
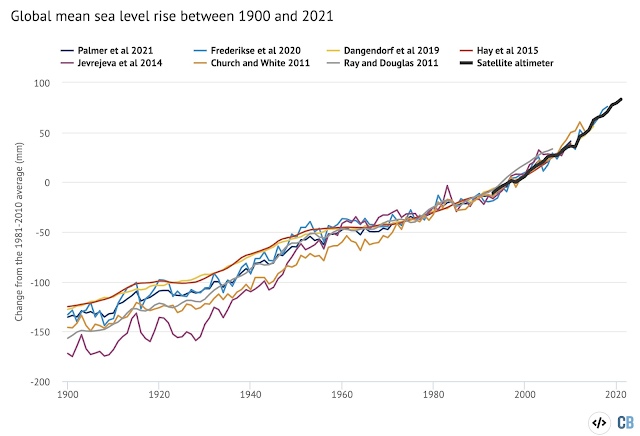
Historical Evidence (Tide Gauges)
Evidence from tide gauges goes back to the 19th century, and with this evidence, scientists are able to produce even more accurate reconstructions of GMSL. The tide gauge evidence shows a clear increase in sea levels, even accounting for wider confidence intervals earlier in the record.[3]

The graph also shows a clear upward curve in the data, indicating acceleration, beginning somewhere around 1960. Several studies have sought to quantify the amount of acceleration that can be seen in the GMSL record from tide gauges. Some simply show a significant change in linear trends between two portions of the time series. For instance, in 2009, Merrifield et al[4] published a paper showing that the SLR trends increased from about 1.5 mm/yr (1962-1990) to about 3.2 mm/yr from 1991 on. The GMSL trend from tide gauges was similar to trends from satellites. Later in 2017, Dangendorf et al[5] published a study with similar results. The SLR trend of 1.1 mm/yr before 1990 increased to 3.1 mm/yr (1993-2012).
Both of these studies confirmed expectations that GMSL would accelerate in the 1990s, since global warming trends became clearly separable from internal variability in the 1980s. However, recent analyses also showed that acceleration could be detected earlier in the time series, since about 1960. For instance, in 2017, Frederikse et al [6] published a study showing an average trend of 1.5 mm/yr (1958-2014), but also quantified the rate of acceleration over that time frame to 0.07 ± 0.02 mm/yr^2.
 |
| Dangendorf 2019 |
This finding was confirmed by Dangendorf in 2019.[7] His analysis examined a hybrid tide gauge and satellite GMSL reconstruction from 1900 to 2015 and found that SLR had been accelerating since the 1960s. Dangendorf's analysis also found an acceleration of 0.06 ± 0.01 mm/yr^2 from 1968-2015. These two studies with tide gauge (and hybrid) evidence clearly shows that SLR rates varied between 1 mm/yr and 2 mm/yr until about 1990, and after ~1990, they accelerated to 3 mm/yr or more. Long term acceleration since about 1960 is 0.07 ± 0.02 mm/yr^2.
Another study, Houston 2021[23], performed an analysis of the top 149 tide gauges - those with 75 years of data that extend up to 2017-2019 and found a mean acceleration of 0.0128 ± 0.0064 mm/y^2 (95% CL) since 1945. The longer time period covered in this study (75 years) suggests that acceleration rates have increased, since tide gauge estimates covering more recent years indicate more acceleration.
Satellite Evidence
The tide gauge record has the advantage of length. GMSL reconstructions from tide gauges can extend back over 100 years. The advantage of satellite reconstructions is that they can provide near-global coverage, including not just shorelines but all of the ocean surface. However, there are three significant limitations to this approach. First, there have been several satellite missions, and differences between the satellites can introduce bias into the record. Second, satellites tend to drift in their orbits. If they drift slightly closer to the earth, they can introduce bias into the satellite record. So significant adjustments need to be made to ensure the accuracy of the reconstruction.
Third, satellites have been able to estimate GMSL only since about 1993, meaning that we are just now approaching 30 years of satellite data on GMSL. Within this shorter time frame, biases from ENSO and the Pinatubo can obscure the anthropogenic signal in SLR acceleration. These sources of natural variability will not affect long term projections from SLR, so projections for the future based on satellite estimates of SLR acceleration depend on the ability to isolate the anthropogenic signal from the noise of natural variability.
In 2017, Yi et al[8] estimated an acceleration of 0.27 ± 0.17 mm/yr^2 (2005-2015), which was significantly larger than the whole the satellite record since 1993. The study estimated that 44% of the acceleration was due to thermal expansion of the oceans, about 41% was due to decreasing terrestrial water storage, and 15% was due to melting terrestrial ice. On decadal time scales, these values are likely significantly affected by natural variability, and I have little confidence that this value will remain this high. So two other studies published in 2017 showed significant acceleration over longer time periods - satellite altimetry era (beginning in 1993. Dieng et al[9] quantified the drift in the TOPEX A altimeter to 1.5 ± 0.5 mm/yr (1993-1998). With this correction to bias for satellite drift, the GMSL rate from 1993 to 2015 was calculated to be about 3 mm/yr, but the study also found that GMSL rates increased by about 0.8 mm/yr (20014-2015), largely due to an increase in mass loss from the Greenland ice sheet. Chen et al[10] also showed that global SLR rates increased from 2.2 mm/yr in 1993 to 3.3 mm/yr in 2014, and the confidence intervals associated with these estimates show there has been an acceleration within the altimeter record.
 |
| Adjustments for Pinatubo & ENSO in Nerem 2018 |
Perhaps the most influential study of acceleration within the altimeter era was Nerem et al 2018.[11] Nerem was able to account for the Pinatubo eruption and ENSO to isolate the anthropogenic signal in SLR acceleration. His acceleration estimate was 0.084 ± 0.025 mm/y^2 (1993-2017). His calculated SLR rates and acceleration are consistent with about 2 ft of sea level rise by 2100 compared with 2005. This finding has been replicated several times (see below).
In 2019, Kleinherenbrink et al[12] challenged the amount of acceleration calculated by Nerem and others. His published a study that is a bit of an outlier, but it illustrates some of the difficulties in performing bias corrections on altimeter data from satellites. This study increased estimated SLR rates earlier in the satellite record (1993-1999), thus diminishing the amount of acceleration within 1993 to 2016 to between 0.015 mm/yr^2 and 0.019 mm/yr^2. These values were statistically significant to 1-sigma confidence but not 2-sigma confidence. So with this approach SLR acceleration between 1993 and 2016 is likely but not virtually certain. Their revision of acceleration rates previously calculated (see above) depended on bias correction methods from satellite drift and the merging of data from the satellite missions from 1993 to 2016. A later study commented on the results of this paper and believes this paper artificially removes acceleration that actually took place.[15] Kleinherenbrink et al do not account for the effects of ENSO or Pinatubo, and their results have not been replicated by other studies. At least one attempt failed because the authors didn't respond to requests from data.[21] But it should be noted that the results of this study decrease the amount of acceleration within 1993 - 2016 by increasing SLR rates earlier in the time series. There is still a significant acceleration between 1993 -2016 and earlier portions of the GMSL record.
Also in 2019, Ablain et al[22] replicated Nerem's findings and calculated acceleration to be 0.12 ± 0.07 mm/yr^2 (90 % CL).The following year, The Climate Change Initiative Coastal Sea Level Team published a study[13] estimating SLR mean rate and acceleration (1993-2019) to be 3.3 mm/yr and ~0.1 mm/yr^2. In 2021, Wang et al[14] also replicated the results of Nerem 2018 by calculating an acceleration of 0.094 ± 0.036 mm/yr^2 (90% CL) from 1993-2018.
 |
| Summary from Veng et al 2021 |
And finally, Veng et al 2021[15] further replicates the findings of Nerem et al 2018. This study used data from both the TOPEX/Poseidon/Jason missions (TPJ) and the European ERS/Envisat/CryoSat missions (ESA). The ESA missions expand the geographic coverage from ± 66° to ± 82° latitudes and to over 27 years of data (1991.7 - 2019.0) over earlier TPJ-based studies. The results of their acceleration calculations were:
ESA (1991-2019 and ± 82° latitude): 0.095 ± 0.009 mm/yr^2
TPJ (1993-2019 and ± 66° latitude): 0.080 ± 0.008 mm/yr^2
Also similar to Nerem and several other studies mentioned above, Veng and his colleagues accounted for the Pinatubo effect adding bias to the satellite record. Given the extended time series and spatial coverage of the ESA missions, the 0.095 ± 0.009 mm/yr^2 estimate is probably better.
Guérou et al 2023[24] also evaluated multiple estimates of acceleration from NASA, NOAA, UC, and CSIRO, and then calculated their own estimate to be 0.12 mm/yr^2. "We estimate the acceleration of the GMSL rise to 0.12 ± 0.05 m yr−2 which confirms previous analysis in the literature demonstrating that the GMSL record is accelerating (
Watson et al.,
2015;
Dieng et al.,
2017;
Beckley et al.,
2017;
Nerem et al.,
2018;
Ablain et al.,
2019;
Veng and Andersen,
2020)."
The large majority of the evidence regarding global SLR acceleration to date shows acceleration to be in the neighborhood 0.1 mm/yr^2.
Update 2026. A new study, Zheng et al 2026[25] closed the GMSL and acceleration budgets and arrived at values of 0.71 ± 0.18 mm year−1 decade−1 for 1960–2023 and 0.84 ± 0.66 mm year−1 decade−1 for 1905–2023.
Conclusion
Acceleration in global SLR is the near universal conclusion of the peer-reviewed literature, whether the analysis is from paleoclimate studies, the historical record from tide gauges or the satellite record since the early 1990s. These studies are further corroborated by studies finding accelerated ice mass loss from Greenland, Antarctica and mountain glaciers.[16][17] And further studies find a clear anthropogenic signal in global sea level rise.[18][19]
And the acceleration estimates from these studies are very consistent with the IPCC's projection that without significant reductions in carbon emissions we can expect as much as 0.6 meters of SLR by 2100 with 4 meters or more possible by 2300.[20] There is very little chance that we will experience SLR rates approaching the rates we experienced coming out the the LGM, but we may experience sudden pulses of SLR if glaciers and ice sheets rapidly collapse. However, the rates we are likely to experience will create numerous problems for tens of millions of people living in coastal areas, including increased storm damage inland and more regular flooding in low lying areas even when no storm is approaching. It is one of the clearest indicators of disruption from AGW to negatively impact large numbers of people in upcoming decades.
References
[2] “The 20th century rise was extremely likely faster than during any of the 27 previous centuries. Semiempirical modeling indicates that, without global warming, GSL in the 20th century very likely would have risen by between −3 cm and +7 cm, rather than the ∼14 cm observed.”
Kopp, Robert E., et al. "Temperature-driven global sea-level variability in the Common Era." Proceedings of the National Academy of Sciences 113.11 (2016): E1434-E1441.
[3] Climate Feedback. "Global data contradict claim of no acceleration in sea level rise."
https://climatefeedback.org/claimreview/global-data-contradict-claim-of-no-acceleration-in-sea-level-rise/
[4] "The average global sea level trend for the time segments centered on 1962–90 is 1.5 ± 0.5 mm yr−1 (standard error), in agreement with previous estimates of late twentieth-century sea level rise. After 1990, the global trend increases to the most recent rate of 3.2 ± 0.4 mm yr−1, matching estimates obtained from satellite altimetry."
[5] "Our reconstructed GMSL trend of 1.1 ± 0.3 mm⋅y−1 (1σ) before 1990 falls below previous estimates, whereas our estimate of 3.1 ± 1.4 mm⋅y−1 from 1993 to 2012 is consistent with independent estimates from satellite altimetry, leading to overall acceleration larger than previously suggested."
Dangendorf, S., Marcos, M., Wöppelmann, G., Conrad, C. P., Frederikse, T. and Riva, R., 2017, 'Reassessment of 20th century global mean sea level rise', Proceedings of the National Academy of Sciences 114(23), 5946–5951 (DOI: 10.1073/pnas.1616007114).
https://www.pnas.org/content/pnas/early/2017/05/16/1616007114.full.pdf
[6] "The global-mean sea level reconstruction shows a trend of 1.5 ± 0.2 mm yr−1 over 1958–2014 (1σ), compared to 1.3 ± 0.1 mm yr−1 for the sum of contributors. Over the same period, the reconstruction shows a positive acceleration of 0.07 ± 0.02 mm yr−2, which is also in agreement with the sum of contributors, which shows an acceleration of 0.07 ± 0.01 mm yr−2. Since 1993, both reconstructed sea level and the sum of contributors show good agreement with altimetry estimates."
Frederikse, T., Jevrejeva, S., Riva, R. E. M., & Dangendorf, S. (2018). A Consistent Sea-Level Reconstruction and Its Budget on Basin and Global Scales over 1958–2014, Journal of Climate, 31(3), 1267-1280. Retrieved Jan 14, 2021.
https://journals.ametsoc.org/view/journals/clim/31/3/jcli-d-17-0502.1.xml
[7] "Here we present an improved hybrid sea-level reconstruction during 1900–2015 that combines previous techniques at time scales where they perform best. We find a persistent acceleration in GMSL since the 1960s and demonstrate that this is largely (~76%) associated with sea-level changes in the Indo-Pacific and South Atlantic. We show that the initiation of the acceleration in the 1960s is tightly linked to an intensification and a basin-scale equatorward shift of Southern Hemispheric westerlies, leading to increased ocean heat uptake, and hence greater rates of GMSL rise, through changes in the circulation of the Southern Ocean."
Dangendorf, S., Hay, C., Calafat, F.M. et al. Persistent acceleration in global sea-level rise since the 1960s. Nat. Clim. Chang. 9, 705–710 (2019). https://doi.org/10.1038/s41558-019-0531-8
[8] "Our results show that the acceleration during the last decade (0.27 ± 0.17 mm/yr2) is about 3 times faster than its value during 1993–2014. The acceleration comes from three factors, that is, 0.04 ± 0.01 mm/yr2 (~15%) by land ice melting, 0.12 ± 0.06 mm/yr2 (~44%) by thermal expansion of the seawater, and 0.11 ± 0.02 mm/yr2 (~41%) by declining land water storage. Although these values in 11 years may suffer from natural variabilities, they shed light on the underlying mechanisms of sea level acceleration and reflect its susceptibility to the global warming."
Yi, S., Heki, K., & Qian, A. (2017). Acceleration in the global mean sea level rise: 2005–2015. Geophysical Research Letters, 44, 11,905– 11,913.
https://doi.org/10.1002/2017GL076129[9] "An important increase of the GMSL rate, of 0.8 mm/yr, is found during the second half of the altimetry era (2004–2015) compared to the 1993–2004 time span, mostly due to Greenland mass loss increase and also to slight increase of all other components of the budget."
Dieng, H. B., Cazenave, A., Meyssignac, B., and Ablain, M. (2017), New estimate of the current rate of sea level rise from a sea level budget approach, Geophys. Res. Lett., 44, 3744– 3751,
[10] "Here we show that the rise, from the sum of all observed contributions to GMSL, increases from 2.2 ± 0.3 mm yr−1 in 1993 to 3.3 ± 0.3 mm yr−1 in 2014. This is in approximate agreement with observed increase in GMSL rise, 2.4 ± 0.2 mm yr−1 (1993) to 2.9 ± 0.3 mm yr−1 (2014), from satellite observations that have been adjusted for small systematic drift, particularly affecting the first decade of satellite observations."
Chen, X., Zhang, X., Church, J. et al. The increasing rate of global mean sea-level rise during 1993–2014. Nature Clim Change 7, 492–495 (2017).
https://doi.org/10.1038/nclimate3325https://www.nature.com/articles/nclimate3325[11] "Using a 25-y time series of precision satellite altimeter data from TOPEX/Poseidon, Jason-1, Jason-2, and Jason-3, we estimate the climate-change–driven acceleration of global mean sea level over the last 25 y to be 0.084 ± 0.025 mm/y^2. Coupled with the average climate-change–driven rate of sea level rise over these same 25 y of 2.9 mm/y, simple extrapolation of the quadratic implies global mean sea level could rise 65 ± 12 cm by 2100 compared with 2005, roughly in agreement with the Intergovernmental Panel on Climate Change (IPCC) 5th Assessment Report (AR5) model projections."
Nerem, Robert S., et al. "Climate-change–driven accelerated sea-level rise detected in the altimeter era." Proceedings of the national academy of sciences 115.9 (2018): 2022-2025.
https://www.pnas.org/content/115/9/2022
[13] "When combined, the current satellite altimetry record, 28-year long at the time of writing, shows that the global mean sea level is rising and even accelerating. Over the 1993–2019 time span, the mean rate and the acceleration amount to 3.3 +/− 0.3 mm/yr and ~0.1 mm/yr2 respectively."
The Climate Change Initiative Coastal Sea Level Team., Benveniste, J., Birol, F. et al. Coastal sea level anomalies and associated trends from Jason satellite altimetry over 2002–2018. Sci Data 7, 357 (2020).
https://doi.org/10.1038/s41597-020-00694-w
[14] "After minimising the natural variability related to ENSO and PDO... from altimetry observations, the GMSL trend over 2007–2018 is 3.8 ± 0.3 mm yr−1 for GSFC, or 4.0 ± 0.4 mm yr−1 for CSIRO GIA-adjusted and GPS-adjusted data (90% CL), consistent with trends estimated from longer tide-gauge reconstructions." And, "Correcting for the recovery from the Mt Pinatubo eruption would increase our GSFC estimate to 0.094 ± 0.036 mm yr−2 (90% CL), consistent with the previous estimate of 0.084 ± 0.025 mm yr−2 (one standard deviation) over 1993–2017."
[15] "We find an acceleration term in the ERS-1 and ERS-2 timeseries (includes the Pinatubo effect). Monthly crossover analysis, as performed by Kleinherenbrink et al (2019), likely removes the GMSL acceleration in this part of the time-series. We suspect that this result in a significantly lower GMSL acceleration estimate but this need further investigation." and
"GMSL based on ESA data on the 1991–2019 period within ± 82° latitude exhibit an acceleration of 0.095 ± 0.009 mm/yr2. The corresponding value for the TPJ data is 0.080 ± 0.008 mm/yr2 for the 1993–2019 period and within ± 66° latitude. The ERS-1 satellite was launched shortly after the large Pinatubo eruption in 1991. The satellite observes a decrease of 6 mm in GMSL during the first 1.7 years until the launch of TOPEX/Poseidon. The distribution of sea level acceleration across the global ocean is highly similar between the ESA and TPJ dataset."
Tadea Veng, Ole B. Andersen. Consolidating sea level acceleration estimates from satellite altimetry. Advances in Space Research 68.2 (2021): 496-503. https://doi.org/10.1016/j.asr.2020.01.016.
[16] Trusel, Luke D., et al. "Nonlinear rise in Greenland runoff in response to post-industrial Arctic warming." Nature 564.7734 (2018): 104-108.
https://www.nature.com/articles/s41586-018-0752-4[17] Slater, T., Lawrence, I. R., Otosaka, I. N., Shepherd, A., Gourmelen, N., Jakob, L., Tepes, P., Gilbert, L., and Nienow, P.: Review article: Earth's ice imbalance, The Cryosphere, 15, 233–246, https://doi.org/10.5194/tc-15-233-2021, 2021.
https://tc.copernicus.org/articles/15/233/2021/[18] Marcos, M., and Amores, A. (2014), Quantifying anthropogenic and natural contributions to thermosteric sea level rise, Geophys. Res. Lett., 41, 2502– 2507, doi:
10.1002/2014GL059766.
https://agupubs.onlinelibrary.wiley.com/doi/full/10.1002/2014GL059766[19] Slangen, A. B. A., Church, J. A., Zhang, X., and Monselesan, D. (2014), Detection and attribution of global mean thermosteric sea level change, Geophys. Res. Lett., 41, 5951– 5959, doi:
10.1002/2014GL061356.
https://agupubs.onlinelibrary.wiley.com/doi/full/10.1002/2014GL061356
[21] "A critical issue for the SA data sets, as mentioned before, was raised by Kleinherenbrink et al. (2019). Their assessment of the globally averaged SA data uncertainties rendered the GMSL acceleration claimed by Nerem at al.,2018, and Ablain et al., 2019) statistically not significant at a 95% confidence level. Nonetheless, our inquiries to obtain the revised data used in their study to replicate their result were unanswered. Hence, we will assume that the above data set is still viable for this investigation because this series was also nearly replicated by the other data centers "
İz, H. Bâki and Shum, C.K.. "Recent and future manifestations of a contingent global mean sea level acceleration" Journal of Geodetic Science, vol. 10, no. 1, 2020, pp. 153-162.
https://doi.org/10.1515/jogs-2020-0115
[22] "Over 1993–2017, we have found a GMSL trend of 3.35±0.4 mm yr−1 within a 90 % confidence level (CL) and a GMSL acceleration of 0.12±0.07 mm yr−2 (90 % CL). This is in agreement (within error bars) with previous studies."
Ablain, M., Meyssignac, B., Zawadzki, L., Jugier, R., Ribes, A., Spada, G., Benveniste, J., Cazenave, A., and Picot, N.: Uncertainty in satellite estimates of global mean sea-level changes, trend and acceleration, Earth Syst. Sci. Data, 11, 1189–1202, https://doi.org/10.5194/essd-11-1189-2019, 2019.
[23] "Mean and median sea-level accelerations based on these gauges were 0.0128 ± 0.0064
mm/y^2 and 0.0126 ± 0.0080 mm/y^2
, respectively, both at the statistically significant 95% confidence level."
Houston, J.R., 2021. Sea-level acceleration: Analysis of the world's high-quality tide gauges. Journal of Coastal Research, 37(2), 272–279. Coconut Creek (Florida), ISSN 0749-0208.
[24] "As shown in Fig.
3, we estimate the GMSL rise over the 29 years of the altimetry record, from January 1993 to December 2021, to 3.3 ± 0.3 m yr−1. We estimate the acceleration of the GMSL rise to 0.12 ± 0.05 m yr−2 which confirms previous analysis in the literature demonstrating that the GMSL record is accelerating (
Watson et al.,
2015;
Dieng et al.,
2017;
Beckley et al.,
2017;
Nerem et al.,
2018;
Ablain et al.,
2019;
Veng and Andersen,
2020). The trend and acceleration estimates of the previous L2P 18 GMSL record, over the period January 1993 to October 2017, also corrected for the TP-A drift, were 3.1 ± 0.4 and 0.12 ± 0.07 m yr−2, respectively (
Ablain et al.,
2019)"
Guérou, A., Meyssignac, B., Prandi, P., Ablain, M., Ribes, A., and Bignalet-Cazalet, F.: Current observed global mean sea level rise and acceleration estimated from satellite altimetry and the associated measurement uncertainty, Ocean Sci., 19, 431–451, https://doi.org/10.5194/os-19-431-2023, 2023
[25] "For acceleration (calculated by a quadratic linear fit), the GMSL composite suggests an acceleration of 0.71 ± 0.18 mm year−1 decade−1 for 1960–2023, with individual contributions summing to 0.86 ± 0.10 mm year−1 decade−1. This agreement gives confidence that the current estimates can robustly quantify the causes of GMSL acceleration over the past 60 years."
Huayi Zheng et al. ,Improved closure of the global mean sea level budget from observational advances since 1960.Sci. Adv.12,eaea0652(2026).DOI:
10.1126/sciadv.aea0652


Comments
Post a Comment