How Do We Know that Increasing CO2 Causes Warming?
This is part 1 of a two part post.
Observational evidence has also confirmed strong correlations between GMST and the radiative forcings CO2. This is clearly seen in the instrumental record since 1850, in ice core records going back over 800,000 years, and across the Phanerozoic (the last 500 million years). On each time scale, we can see that increasing increases in CO2 correspond with increases in temperature. Correlation isn't causation, though. In order to conclusively demonstrate that increasing atmospheric CO2 pushes climate towards warming, we need to get past mere correlation to get at causation, and this can be a challenging task. In 2016, though, as study was published in Nature Scientific Reports that successfully did exactly that.[8] This study not only demonstrated causation, it demonstrated the direction of causation in precisely the directions that are predicted by climate science. To understand this, we need to back up and consider how climate scientists expect the direction of causation to proceed at various times in geologic history.
According to climate theory, global warming can either lead or lag increases CO2; it can be either a driver or a feedback. During intense carbon intrusion events, like the end-Permian extinction or the PETM, the intrusion of CO2 precedes warming. However, during the glacial cycles of the Quaternary (until the Industrial Revolution), CO2 lags warming. Warming is triggered by orbital cycles which increases sea surface temperatures. Since CO2 is less soluble in warmer waters, increasing sea surface temperatures leads to the degassing of CO2 from the oceans. The increase in CO2 is expected to amplify warming, which then causes more ice to melt. As surface area covered by highly reflective ice diminishes, albedo decreases - the earth absorbs more solar energy and reflects less. That means more heat radiated from the earth can be trapped by CO2, etc. The cycle continues until a new equilibrium is reached at a warmer temperatures. Recent estimates of the difference in global temperature from the last glacial maximum (LGM) to the Holocene thermal maximum (HTM) is roughly 6 C, while CO2 increased by roughly 100 ppm. This suggests that increasing CO2 as a feedback to warming triggered by orbital cycles is about 17 ppm/C warming. However, following the Industrial Revolution, CO2 increased dramatically and warming followed the increase in CO2, with the oceans becoming a net CO2 sink.
For the sake of simplicity, let's refer to CO2 as C and GMST as T. To establish causation and confirm the theoretical predictions of climate science, we need to show both that causation exists and the direction of causation. That is, we need to show 1) that there's a causal relationship between C and T, 2) that during recent warming, the direction of causation was C -> T, and 3) during the glacial cycles of the Quaternary, where CO2 is expected to amplify a warming signal as a feedback, we'd expect the direction of causation in the opposite direction, or T -> C. And we need a method of doing so that goes beyond establishing correlation; we need to establish causation.
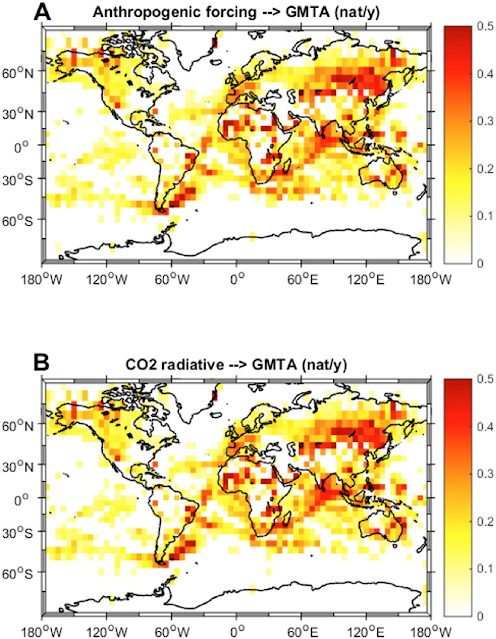
Stips' paper accomplished this by employing a newly developed information flow (IF) method for determining causation. Prior to this type of analysis climate research, the direction of causation was frequently done by employing the use of models. But Stips' paper was able to do so without relying on them.In this study, we use a recently developed mathematical method, which is capable of quantitatively evaluating the drive and feedback causal relation between time series, to address the importance of the different forcing components on climate in a quantitative but model independent way.
 |
| Global information flow from radiative CO2 forcing to GMTA. |
The evidence conclusively demonstrates the causal relationship between C and T with the direction of causation corresponding with the the direction of the theoretical predictions of climate science. This is compelling evidence. We can add to this evidence, empirical observations of the Greenhouse effect at two locations on the earth's surface[10] and at the top of the atmosphere from satellites.[11][12] The experiments in these studies add further observational evidence of the Greenhouse effect, where increasing CO2 produces an increase in radiative forcing as CO2 traps IR light from escaping into space. In the future, I plan to cover these in greater detail as a Part 2 to this post.
References:
[1] Eunice Foote, “Circumstances Affecting the Heat of Sun’s Rays”, in American Journal of Art and Science, 2nd Series, v. XXII/no. LXVI, November 1856, p. 382-383.
https://publicdomainreview.org/collection/first-paper-to-link-co2-and-global-warming-by-eunice-foote-1856
[2] "The bearing of this experiment upon the action of planetary atmospheres is obvious. The solar heat possesses, in a far higher degree than that of the lime light, the power of crossing an atmosphere; but, and when the heat is absorbed by the planet, it is so changed in quality that the rays emanating from the planet cannot get with the same freedom back into space. Thus the atmosphere admits of the entrance of the solar heat, but checks its exit; and the result is a tendency to accumulate heat at the surface of the planet. In the admirable paper of M. Pouillet already referred to, this action is regarded as the cause of the lower atmospheric strata being warmer than the higher ones; and Mr. Hopkins has shown the possible influence of such atmospheres upon the life of a planet situated at a great distance from the sun."
John Tyndall (1859), "On the Transmission of Heat of different qualities through Gases of different kinds."
https://ozonedepletiontheory.info/Papers/Tyndall1859TransmissionHeat.pdf
[3] Erik Christensen. "The Greenhouse Gas Demo."
https://www.youtube.com/watch?v=kwtt51gvaJQ
[4] On the Influence of Carbonic Acid in the Air upon the Temperature of the Ground Svante Arrhenius Philosophical Magazine and Journal of Science Series 5, Volume 41, April 1896, pages 237-276.
https://www.rsc.org/images/Arrhenius1896_tcm18-173546.pdf
[5] PLASS, G.N. (1956), The Carbon Dioxide Theory of Climatic Change. Tellus, 8: 140-154. https://doi.org/10.1111/j.2153-3490.1956.tb01206.x
[6] Manabe, S., & Wetherald, R. T. (1967). Thermal Equilibrium of the Atmosphere with a Given Distribution of Relative Humidity, Journal of Atmospheric Sciences, 24(3), 241-259. Retrieved Jun 24, 2022, from https://journals.ametsoc.org/view/journals/atsc/24/3/1520-0469_1967_024_0241_teotaw_2_0_co_2.xml
[7] Jule Charney. Carbon Dioxide and Climate: A Scientific Assessment. https://geosci.uchicago.edu/~archer/warming_papers/charney.1979.report.pdf
[8] Stips, A., Macias, D., Coughlan, C. et al. On the causal structure between CO2 and global temperature. Sci Rep 6, 21691 (2016).
https://www.nature.com/articles/srep21691
[9] Schreiber, T. Measuring information transfer. Phys. Rev. Lett. 85, 461 (2000).
https://journals.aps.org/prl/abstract/10.1103/PhysRevLett.85.461
[10] Feldman DR, Collins WD, Gero PJ, Torn MS, Mlawer EJ, Shippert TR. Observational determination of surface radiative forcing by CO2 from 2000 to 2010. Nature. 2015;519(7543):339‐343. doi:10.1038/nature14240
https://www.nssl.noaa.gov/users/dturner/public_html/metr5970/2015_nature.feldman_AERI_obs_CO2_forcing_over_last_decade.pdf
https://escholarship.org/content/qt3428v1r6/qt3428v1r6_noSplash_b5903aebfe105b4071103e11197138f8.pdf
[11] Harries, J. E., H. E. Brindley, P. J. Sagoo, and R. J. Bantges, 2001: Increases in greenhouse forcing inferred from the outgoing longwave radiation spectra of the Earth in 1970 and 1997. Nature, 410, 355-357.
https://www.researchgate.net/publication/12065270_Increases_in_greenhouse_forcing_inferred_from_the_outgoing_longwave_radiation_spectra_of_the_Earth_in_1970_and_1997
[12] Kramer, R. J., He, H., Soden, B. J., Oreopoulos, L., Myhre, G., Forster, P. M., & Smith, C. J. (2021). Observational evidence of increasing global radiative forcing. Geophysical Research Letters, 48, e2020GL091585.
https://doi.org/10.1029/2020GL091585
[13] Wordsworth, R., Seeley, J. T., & Shine, K. P. (2024). Fermi Resonance and the Quantum Mechanical Basis of Global Warming. The Planetary Science Journal, 5(3), 67. DOI: 10.3847/PSJ/ad226d
https://iopscience.iop.org/article/10.3847/PSJ/ad226d/pdf


Comments
Post a Comment