Updated Calculation for ECS and TCR
Every year I try to think of a way to update my simple calculations for ECS and TCR. My methods don't really change that much; they reflect updated data and become a little more complex. Make no mistake, they are simple calculations based on estimates of forcings, temperature and EEI using the energy balance equation. It doesn't compete with peer-reviewed studies by Sherwood[1] or the assessments of the IPCC. My intent with this is to show that the central estimates of the IPCC (and most climate models) are very consistent with empirical data.
The first step in the calculating ECS and TCR values is assessing the earth's energy imbalance and collecting the relevant forcing data.
Earth's Energy Imbalance
There are several estimates for EEI to choose from, but I think the most conservative approach is to use an average value for the full time frame between 2005 and 2019, when observations become much more reliable. One study, Loeb et al 2021[2] estimated EEI to be 0.77 ± 0.06 W/m^2 from mid-2005 to mid-2019. Loeb also observed that EEI is increasing at of 0.4 W/m^2/decade for March 2000 through December 2021. More recently, Trenberth et al 2022[3] arrived at a slightly higher value from CERES data 0.90 ± 0.15 W/m^2 for 2015-2019. The estimate from CERES is confirmed by adding up the ice, land, atmosphere and ocean heat content (OHC-ORAS5), which total 0.9 W/m^2, though if you add these values with IAP for OHC, you get 0.7 W/m^2, which is lower than the CERES estimate.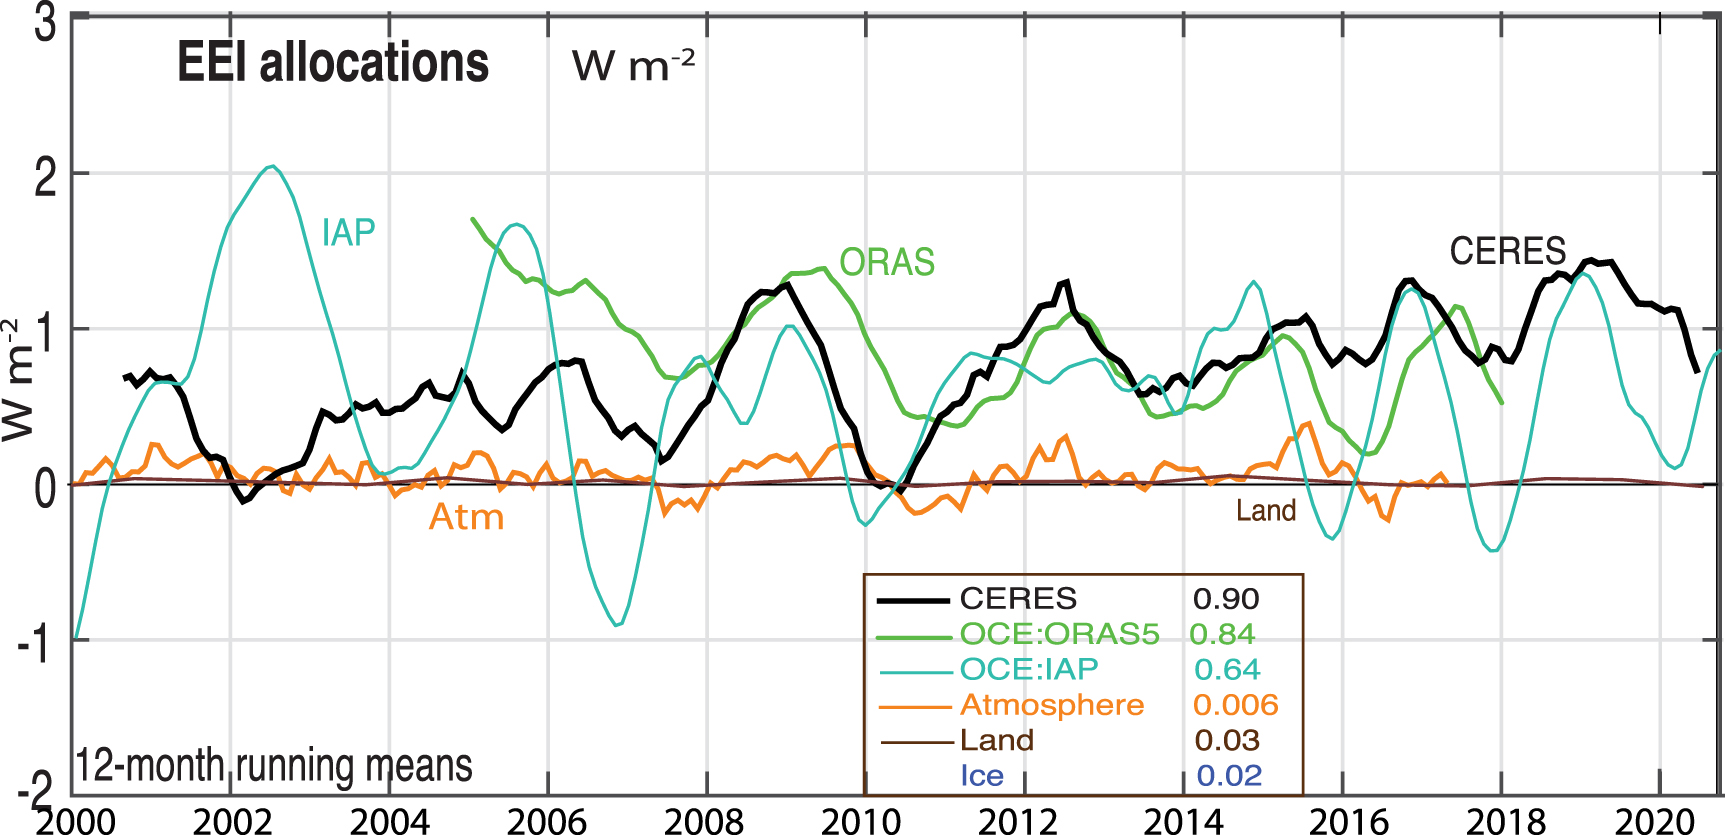
Since EEI is increasing, I'm tempted to use the higher value. However, given the uncertainty from Trenberth's estimate, I think it better to be conservative. I'll make two calculations of ECS, my main calculation with a conservative estimates (here using Loeb's estimate of 0.77 W/m^2) and another calculation using less conservative estimates (here using Trenberth's estimate of 0.9 W/m^2).
Greenhouse Gas Forcings
For greenhouse gases, I decided to use forcing values on NOAA's website, since it contains a table of all the major greenhouse gases and their associated forcings. I averaged the total greenhouse gas forcings for 2005 to 2019 to match the same time period of Loeb's EEI estimate.
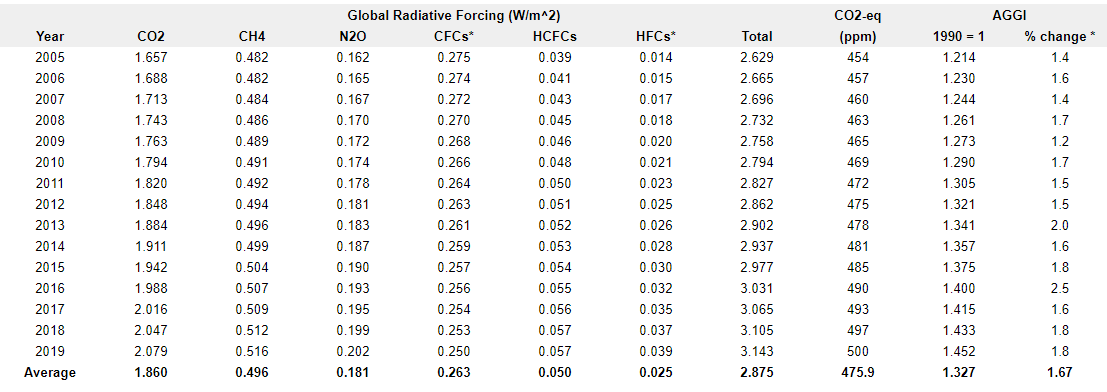
The average total GHG forcings for 2005-2019 is 2.875 W/m^2 above 1750 values when CO2 was ~280 ppm.
Aerosol Forcings
Smith et al 2021[4] calculated the aerosol forcings from 1750 to 2019 to be −0.9 (−1.5 to −0.4) W/m^2. Their value for 2005 to 2014 was −1.1 (−1.8 to −0.5) W/m^2. For my standard calculation, I'll use the more conservative -0.9 W/m^2. For my second calculation, I'll average both at -1.0 W/m^2.

Solar Forcings
Compared to anthropogenic forcings, solar forcings are negligible. The forcing values would easily fit within the confidence intervals of anthropogenic forcings. But in the interest of being conservative, I calculated the average 1750-1800 value for TSI from Kopp to be 1361.22 W/m^2 and the average 2005-2018 value to be 1361.30 W/m^2. The difference is only 0.08 W/m^2. Converting the change in TSI to radiative forcing results in a forcing of 0.014 W/m^2. This value is so small I don't need to include it, but since including it will lower ECS slightly, I'll include it.
.png)
Calculating ECS and TCR
References:
[1] Sherwood, S. C., Webb, M. J., Annan, J. D., Armour, K. C., Forster, P. M., Hargreaves, J. C., et al. (2020). An assessment of Earth's climate sensitivity using multiple lines of evidence. Reviews of Geophysics, 58, e2019RG000678. https://doi.org/10.1029/2019RG000678
[2] Loeb, N. G., Johnson, G. C., Thorsen, T. J., Lyman, J. M., Rose, F. G., & Kato, S. (2021). Satellite and ocean data reveal marked increase in Earth’s heating rate. Geophysical Research Letters, 48, e2021GL093047. https://doi.org/10.1029/2021GL093047[4] Smith, C. J., Harris, G. R., Palmer, M. D., Bellouin, N., Collins, W., Myhre, G., et al. (2021). Energy budget constraints on the time history of aerosol forcing and climate sensitivity. Journal of Geophysical Research: Atmospheres, 126, e2020JD033622. https://doi.org/10.1029/2020JD033622
https://agupubs.onlinelibrary.wiley.com/doi/10.1029/2020JD033622


Comments
Post a Comment