Tony Heller on Arctic Sea Ice
I wonder if there's a climate conspiracy that isn't found on Tony Heller's blog in some way, shape or form. We have plenty of empirical data showing the decline in Arctic Sea Ice, but according to Tony Heller, that's not the case, and NOAA is actively hiding data that would prove them wrong. According to him, we have satellite data going back to 1972, but NOAA only shows data beginning in 1979 because that was a cold year, and if they showed the 1972 -1978 data, it would undermine their claim that Arctic Sea Ice is shrinking. "The reason why NOAA starts their sea ice graphs in 1979, is because it was the coldest year on record in much of the Arctic and the ice was very thick. By starting in 1979, they can defraud the public into believing that the ice is disappearing."[1] But Heller apparently did some sleuthing and found that data in a 1990 IPCC report so he can alert the world to the data that NOAA is hiding away.

But is this data hidden? Well, no. It's publicly available on the internet, though it should be clear from the graph above that the data actually begins in 1973, not 1972. Here are the links that Heller couldn't be bothered to find:
Arctic Sea Ice Extent, 1973-1990, v. 1, G00917I hope you can see here that there is another, far more plausible explanation for why graphs usually begin in 1979. It's not because NOAA wants to defraud the public. It's because the 1973-1990 dataset published in the 1990 IPCC report has a much lower resolution, both spatially and temporally, so the data quality isn't up to the standards of the other dataset beginning in 1978.
https://nsidc.org/data/g00917
Spatial Resolution: 10 degrees x 1 degree (1110 km x 111 km)
Temporal Resolution: 1 month
Arctic Sea Ice Extent, 1978-Present, v. 3, G02125
https://nsidc.org/data/G02135/versions/3
Spatial Resolution: 25 km x 25 km
Temporal Resolution: 1 day
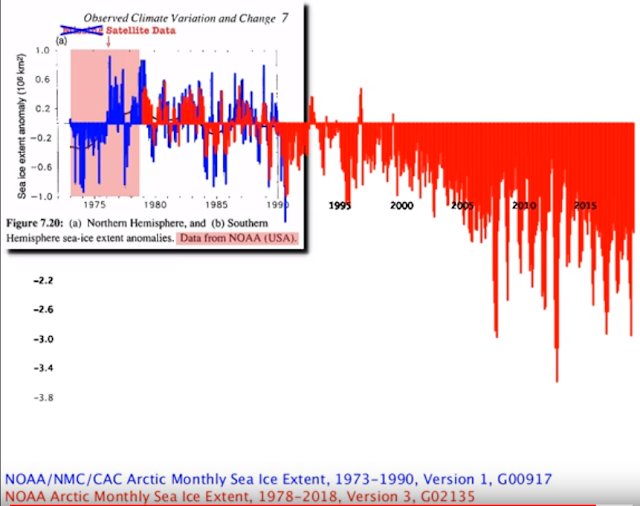
But what would happen if we just went ahead and plotted the two datasets from 1973 to present? What would we find? Would we evidence showing that we aren't losing Arctic Sea Ice? Not at all. Above I show a YouTube video from Kevin Pluck showing you what happens if you were to put both graphs together as well as a screenshot showing both together. Two things should be obvious here. First, the older dataset (blue) shows more variability than the newer dataset (red), which may explain why graphs usually begin in 1979. Second, whether you include the 1973-1978 data or not, It should be obvious that Arctic Sea Ice is rapidly declining.


Resources:
[1] Tony Heller. "Arctic Sea Ice Unchanged From 60 Years Ago."
https://realclimatescience.com/arctic-sea-ice-unchanged-from-60-years-ago/
[2] Kevin Pluck. "Arctic Sea Ice Anomaly IPCC 1990."
https://www.youtube.com/watch?v=ehm88vGAsU0
https://atmos.uw.edu/~mkb22/files/Brennan_etal_2020.pdf
[4] Kinnard, C., Zdanowicz, C., Fisher, D. et al. Reconstructed changes in Arctic sea ice over the past 1,450 years. Nature 479, 509–512 (2011). https://doi.org/10.1038/nature10581
https://www.researchgate.net/publication/51825483_Reconstructed_changes_in_Arctic_sea_ice_over_the_past_1450_years


Comments
Post a Comment