 |
| RSSv.4.0 and UAHv.6.0 Satellite Temperatures |
In a previous
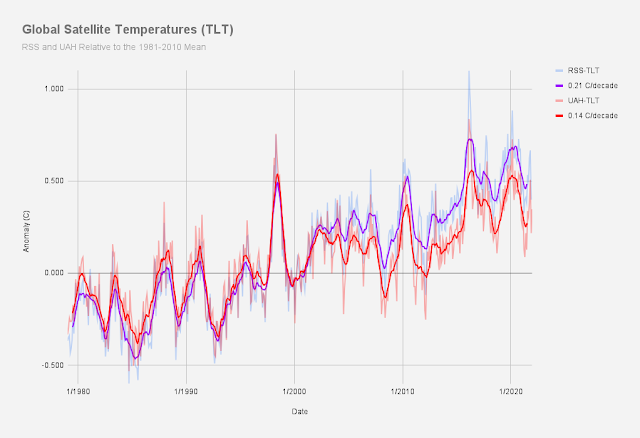
post, I summarized the most important reasons why the instrumental record is more accurate than satellites, and I showed that there is far more disparity between satellite datasets than there are among GMST datasets. In this post, I'd like to examine the satellite datasets to see if we can say to what extent some are more accurate than others. There are several satellite datasets, but three (RSS, UW and NOAA) strongly agree with each other, while the dataset from UAH is the outlier of the four. Keep in mind that in general all four of these use the same satellites So for the sake of simplicity, I'm going to simply compare RSS and UAH.
University of Alabama Huntsville (UAH)
The UAH dataset is maintained by John Christy and Roy Spencer. For better or for worse, these scientists have strong disagreements with many of the conclusions of mainstream climate scientists. And at least in the opinion of many, perhaps not coincidentally their dataset shows the least amount of warming. There seems to be a lot of antagonism from among at least some mainstream climate scientists towards the UAH product, stemming from the perception that the UAH scientists are motivated to produce a time series with less warming than is actually happening. And that perception is the result of some corrections that need to be made to the UAH dataset in the 8 years or so following 1997. At that time, the satellite time series from UAH showed no warming in the troposphere, despite almost 20 years of satellite data. During the same time period, surface thermometers were showing a clear warming trend. However, in 1997 an independent analysis of UAH's data uncovered spurious jumps in the data that occurred at satellite changes. Correcting for these would cause UAH to show a warming trend.
Here we present comparisons among different MSU retrievals, sea surface temperatures (SSTs), and equivalent MSU temperatures derived from an atmospheric general circulation model forced with observed SSTs. The comparisons, focused on the tropics where atmospheric temperatures are closely tied to SSTs, strongly suggest that two spurious downward jumps occur in the MSU-2R record coinciding with changes in satellites, and that the real trend in MSU temperatures is likely to be positive, albeit small.[1]
It turns out that the satellites that measure the intensity of microwave radiation from oxygen molecules in the atmosphere (from which temperatures are inferred) are subject to drift and orbital decay causing them to lose altitude over time and alters time of observation recorded by the satellites. These were introducing a cooling bias into the data. Correcting for this bias would show that the troposphere had actually been warming since 1979. But the identification of these spurious jumps was met with resistance on the part of Spencer and Christy.[2] "There isn't a problem with the measurements that we can find... In fact, balloon measurements of the temperature in the same regions of the atmosphere we measure from space are in excellent agreement with the satellite results."[3] Resistance to this continued into at least August 1998:
“Recent suggestions that spurious jumps were present in the lower-tropospheric time series of earlier versions of the MSU data based on SST comparisons are addressed. Using independent comparisons of different satellites, radiosondes, and night marine air temperatures, no indication is found of the presence of these ‘spurious’ jumps.[4]
But criticism continued, and later that month, another paper was published in Nature which quantified the magnitude of the needed adjustment and showed that once corrected, temperature trends would increase to 0.07 C/decade.
Here we identify an artificial cooling trend in the satellite-derived temperature series caused by previously neglected orbital-decay effects. We find a new, corrected estimate of +0.07 K per decade for the MSU-based temperature trend, which is in closer agreement with surface temperatures. We also find that the reported cooling of the lower troposphere, relative to the middle troposphere, is another artefact caused by uncorrected orbital-decay effects.[5]
In 1999, a comment to Christy's paper above[4] was published which found that there were "nonnegligible drift related errors in the data of all the satellites" that were causing a spurious cooling trend in data that actually should be showing about 0.1 C/decade warming.[6]
“The results shown above indicate that effects due to satellite drift are evident in NOAA-10, -11, and -12 data. Therefore, we find the assumptions that lead CSL to make drift-related corrections are not realistic. Finally, we contend that further analysis of MSU data is needed before the results of CSL can be accepted.”[6]
The correction was incorporated into version D of the UAH dataset and acknowledged in a paper published in 2000. "Elsewhere, Wentz and Schabel (1998) discovered that the vertical height of the satellites was a critical parameter affecting T2LT and kindly shared their results with us before their paper was published (also August 1998) and just before our version C galley proofs were returned to the printers (thus it is mentioned but not applied to version C in Christy et al. 1998). Their important finding is that altitude losses of only 1 km cause artificial cooling in T2LT while having virtually no effect on T2. The accumulated downward fall of the satellites over the 1979–98 period was over 15 km, and thus became a rather substantial factor requiring attention."[7]
At the same time, developments in the understanding of satellite measurements lead to a better understanding of sources of uncertainty in the satellite data. In 2004, another paper showed that estimates of tropospheric temperature trends are partly contaminated by the stratosphere, since the satellites record a portion of the stratosphere in their measurements. Since the stratosphere is cooling, this introduces a cooling bias into satellite measurements of tropospheric temperature trends. Correcting for this contamination shows that tropospheric temperatures in the tropics are increasing at about 1.6x the surface.[8]
In 2005 Carl Mears and Frank Wentz published another paper identifying errors in the diurnal corrections that are needed to calculate accurate temperature trends. The previously applied correction actually had the opposite sign from what was previously applied (as in, the tropics warmed at night and cooled in the day).[9] This error was more quickly acknowledged and corrected.
We agree with C.A. Mears and F. J. Wentz (“The effect of diurnal correction on satellite-derived lower tropospheric temperature,” Reports, 2 Sept., p. 1548; published online 11 Aug.) that our University of Alabama in Huntsville (UAH) method of calculating a diurnal correction to our lower tropospheric (LT) temperature data (v5.1) introduced a spurious component. We are grateful that they spotted the error and have made the necessary adjustments. The new UAH LT trend (v5.2, December 1978 to July 2005) is +0.123 K/decade, or +0.035 K/decade warmer than v5.1.[10]
A comment to this paper explains some of the context here, and the authors appear to express some amount of frustration or disbelief over the error:
Once we realized that the diurnal correction being used by Christy and Spencer for the lower troposphere had the opposite sign from their correction for the middle troposphere sign, we knew that something was amiss. Clearly, the lower troposphere does not warm at night and cool in the middle of the day. We question why Christy and Spencer adopted an obviously wrong diurnal correction in the first place. They first implemented it in 1998 in response to Wentz and Schabel, which found a previous error in their methodology, neglecting the effects of orbit decay.[11]
Mistakes get made, and I don't want to describe all these mistakes in such a way to impugn the integrity of the scientists at UAH. But this history should show that the model calculations needed to infer temperatures from satellite measurements are exceedingly complex, especially given the related to the instruments themselves. With surface thermometers there are ~100,000 instruments collecting data. A problem with one instrument makes little difference. But with a handful of satellites collecting all the data used to infer tropospheric temperatures, problems with just one can cause much larger errors in temperature trends. That said, UAH shows about 0.14 C/decade warming since 1979, and the needed adjustments found by Wentz, Mears and Shabel account for 0.135 C/decade of that warming trend. I suspect this more than anything else is the reason for the public dissatisfaction with UAH on the part of scientists.
Remote Sensing Systems (RSS)
RSS is a private research company that has been around since the 1970s, but it was the researchers at RSS that found errors in the UAH calculations. From about 2011 to 2017, the RSS satellite dataset actually showed a little bit less warming than UAH. However, in June 2017, version 4 of the the RSS dataset included a very large revision, which increased the warming trend by about 2.4x since 1998.[12] The updated dataset made larger corrections for time of observation adjustments due to orbital drift, but they also instituted corrections to account for times when one satellite returns very different results from the results from two to three other satellites. So some satellites were excluded after certain dates when they became outliers with respect to other satellites.
There have also been updates to instrumentation on these satellites, including the change from the older MSU series of instruments and the newer AMSU series of instruments. The last satellite to use MSU was NOAA-14 and the first to use AMSU was NOAA-15. The satellite NOAA-15 was excluded after 2011, but during the timeframe when NOAA-14 and NOAA-15 overlap, there were differences between them that were caused by "spurious calibration drift" in one or both of the two satellites. Since it was impossible to determine which satellite was the source of the problem, or even if the problem was limited to one satellite, RSS decided to keep both satellites and combine them. If they chose to exclude NOAA-14 and keep NOAA-15, the result would show less warming. If they excluded NOAA-15 and keep NOAA-14, the result would show more warming. Either way, if they chose the wrong satellite to exclude, the adjustment would cause either too much or too little warming. But by combining both they took a via media approach that would minimize the effects of excluding the wrong satellite. The resulting corrections put the RSS satellite temperature trends more in line with the expected trends for the lower troposphere. In fact, RSS warming trends were slightly warmer than GMST measurements.

The adjustment did not go over well on contrarian blogs; the adjustment was perceived as an attempt to modify data to match global warming "alarmism." Anthony Watts invented a conspiracy that Carl Mears wanted there to be warming so much that he just went and found a way to get data to show it. He even invented a term to describe his methodology, which he claimed to be doing science "by slight of hand" - he called it "Karlization."[13] The term comes from another conspiracy theory that Tom Karl looked for SST adjustments that would erase the "pause" following 1998 - such accusations have since been thoroughly discredited. Spencer and Christy were also critical of the adjustment, and argued that NOAA-14 should have been excluded: "We show evidence that MSUs on National Oceanic and Atmospheric Administration’s satellites (NOAA-12 and −14, 1990–2001+) contain spurious warming, especially noticeable in three of the four satellite datasets."[14] He then argues that radiosonde (balloon) data agrees more with UAH and disagrees more with the other three datasets. However, the approach taken by RSS makes sense to me. Carl Mears explains:
So we cannot assume that the problem is with NOAA-14. We instead explore the 3 cases:
- we assume NOAA-14 is wrong and remove it to the extent possible. This leads to a decrease of 0.019K/decade
- we assume NOAA-15 is wrong, and remove it to the extent possible. This leads to an increase of 0.010 K/decade
- we assume that the error is shared between them, and we keep all the data.
These results are reported in the paper, and the differences between them should be viewed as part of the uncertainty in the final results. For the final dataset, we used case 3 where the errors are shared between NOAA-14 and NOAA-15, which is reasonable because we do not know the source of the problem.[15]
We won't solve this here. The approach taken by RSS seems the most reasonable to me because the choice they made minimizes the consequences of being wrong, and since NOAA-15 was excluded after 2011, it seems reasonable that it was at least part of the problem before. Choosing the via media between being too hot and being too cold seems right to me. But that's above my expertise. What should be obvious here is that the uncertainties having to do with determining which satellites to include when has a very significant effect on tropospheric temperature trends, and this largely accounts for the discrepancies between RSS and UAH and for the larger differences between satellite datasets than is found in the instrumental record.
UPDATE (Jan 2025). I decided to plot the trends of UAH and RSS TLT temperatures broken up into different time frames: 1979-1997, 1998-2004, and 2005-2024. RSS and UAH mostly agree (with RSS slowing marginally faster warming) except during 1998-2004, where their trends differ significantly.
Radiosondes & Reanalyses
One way to decide which of these datasets is more accurate is to compare RSS and UAH to some other dataset that measures the same thing. Surface thermometers won't do, since they are too near the surface. But radiosonde (balloon) data and reanalysis data (a hybrid of empirical data and model analysis) provide an independent data source to compare to satellite data. We've seen above that UAH believes their dataset agrees most closely with radiosonde and reanalysis data, and consequently UAH should be trusted above the other datasets. I find this less than convincing for two reasons: 1) radiosonde data has its own biases and uncertainties (see below), and 2) Spencer and Christy have made this argument before when they were unequivocally wrong. Nevertheless, it's certainly valid to consider how radiosonde data and reanalyses compare to RSS and UAH.
 |
| Tropical TMT from 1979-2005: Source |
In a blogpost from 2019, Spencer claims that UAH is likely more reliable than RSS, and supports this claim by showing a graph that shows the differences between satellites and radiosondes and reanalyses for 1979-2005 mid-tropospheric temperatures (TMT) in the tropics.[16] Sure enough, the graph shows UAH has the best agreement. But this comparison has me thinking. Why in 2019 is he cutting off at 2005? And why only the tropics? And why only the mid-troposphere when the lower troposphere is clearly more relevant? This has me suspicious that there's some cherry picking going on.
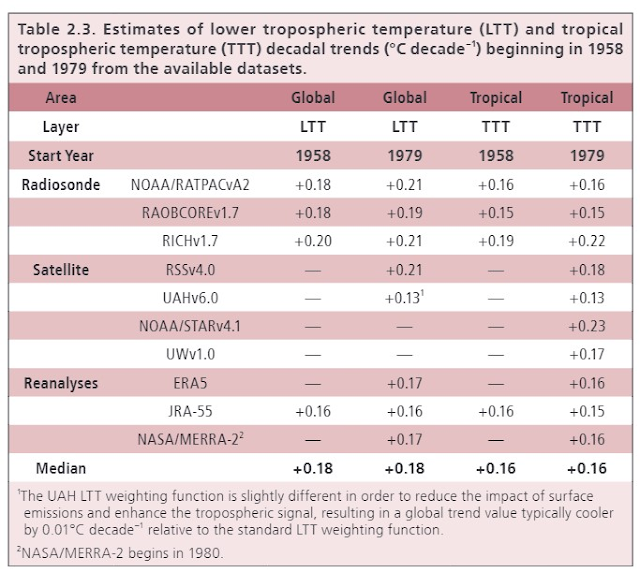
Here's another comparison of the RATPAC radiosonde dataset with RSS and UAH. This is graph is of global lower troposphere temperatures (TLT) from 1979 - 2017 (this was published n 2018). Here it is clear that RATPAC shows even more warming than RSS.[17] Christy says much of the warming in this dataset is spurious, since RATPAC has a "warming bias relative to 7 other radiosonde and reanalysis datasets."[16] But here's another analysis comparing three radiosonde datasets and three analyses (from 1958 on) to RSS and UAH (from 1979 on).
Notice that every single one of these show more warming than UAH. RSS is quite in line with the reanalsyses and radiosondes with UAH showing slightly less warming. A recent climate feedback article also contained an analysis by Stephen Po-Chedley that shows both the global and tropical trends for satellites, radiosondes and reanalyses:[19]
This analysis from 2021 shows that RSSv4.0 agrees most closely to radiosondes in the lower troposphere globally and in tropical troposphere. Reanalyses roughly split the middle between UAH and RSS both globally and in the tropics. Given there are also biases and uncertainties related to radiosonde data,[20][21][22] this is not absolute proof that RSS is more accurate overall.

I decided to plot the above data from Po-Chedley as a graph that mimics the organization of the one Spencer made. To me it seems that at least if we grant the validity of comparing these products to radiosondes and reanalyses, RSS very closely agrees with radiosondes, and reanalyses largely split the difference between the two products. If you average both radiosondes and reanalyses, the balance favors RSS. But let's keep in mind that the uncertainty analysis for RSSv4.0 published by RSS still shows uncertainties larger than the those of surface thermometers and include values produced by UAH.[23] But it does seem that on balance the temperature trends from RSS are better supported by these independent sources of evidence than those from UAH, especially for global TLT trends.
References:
[1] Hurrell, J., Trenberth, K. Spurious trends in satellite MSU temperatures from merging different satellite records. Nature 386, 164–167 (1997).
https://doi.org/10.1038/386164a0
[2] Spencer, “Is Earth's Temperature Up or Down or Both?” (Feb 6, 1997).
http://science.nasa.gov/science-news/science-at-nasa/1997/essd5feb97_1/
[3] Spencer and Christy, “Global Climate Monitoring: The Accuracy of Satellite Data” (Mar 12, 1997)
http://science.nasa.gov/science-news/science-at-nasa/1997/essd12mar97_1/
[4] Christy, J. R., Spencer, R. W., & Lobl, E. S. (1998). Analysis of the Merging Procedure for the MSU Daily Temperature Time Series, Journal of Climate, 11(8), 2016-2041. Retrieved Feb 24, 2021, from
https://journals.ametsoc.org/view/journals/clim/11/8/1520-0442_1998_011_2016_aotmpf_2.0.co_2.xml[5] Wentz, F. J., & Schabel, M. (1998). Effects of orbital decay on satellite-derived lower-tropospheric temperature trends. Nature, 394(6694), 661-664.
https://doi.org/10.1038/29267
[6] Prabhakara, C., & Iacovazzi, R., Jr. (1999). Comments on “Analysis of the Merging Procedure for the MSU Daily Temperature Time Series”, Journal of Climate, 12(11), 3331-3334.
https://journals.ametsoc.org/view/journals/clim/12/11/1520-0442_1999_012_3331_coaotm_2.0.co_2.xml
[7] Christy, J. R., Spencer, R. W., & Braswell, W. D. (2000). MSU Tropospheric Temperatures: Dataset Construction and Radiosonde Comparisons, Journal of Atmospheric and Oceanic Technology, 17(9), 1153-1170. Retrieved Feb 24, 2022, from
https://journals.ametsoc.org/view/journals/atot/17/9/1520-0426_2000_017_1153_mttdca_2_0_co_2.xml[8] Fu, Q., Johanson, C., Warren, S. et al. Contribution of stratospheric cooling to satellite-inferred tropospheric temperature trends. Nature 429, 55–58 (2004).
https://doi.org/10.1038/nature02524[9] C. A. Mears and F. J. Wentz (2005) The Effect of Diurnal Correction on Satellite-Derived Lower Tropospheric Temperature, Science 309, 1548-1551.
https://www.science.org/doi/abs/10.1126/science.1114772?doi=10.1126/science.1114772
[13] Anthony Watts. "The ‘Karlization’ of global temperature continues – this time RSS makes a massive upwards adjustment."
https://archive.is/U5bJi
[16] Roy Spencer. "NOAA, UW: Which Satellite Dataset Should We Believe?"
https://www.drroyspencer.com/2019/04/uah-rss-noaa-uw-which-satellite-dataset-should-we-believe/
[18] Dunn, R. J. H., D. M. Stanitski, N. Gobron, and K. M. Willett, Eds., 2020: Global Climate [in “State of the Climate in 2019"].Bull. Amer. Meteor., 101 (8), S9–S127, https://doi.org/10.1175/BAMS-D-20-0104.1
https://journals.ametsoc.org/view/journals/bams/101/8/bamsD200104.xml?tab_body=pdf[19] Climate Feedback. "NOAA shows clear global warming trends over the past 58 years based on radiosonde data."
https://climatefeedback.org/claimreview/noaa-shows-clear-global-warming-trends-over-the-past-58-years-based-on-radiosonde-data/[20] Randel, W. J., & Wu, F. (2006). Biases in Stratospheric and Tropospheric Temperature Trends Derived from Historical Radiosonde Data, Journal of Climate, 19(10), 2094-2104. Retrieved Jan 3, 2022, from
https://journals.ametsoc.org/view/journals/clim/19/10/jcli3717.1.xmhttp://journals.ametsoc.org/doi/pdf/10.1175/JCLI3717.1[21] Parker, D.E. and Cox, D.I. (1995), Towards a consistent global climatological rawinsonde data-base. Int. J. Climatol., 15: 473-496.
https://doi.org/10.1002/joc.3370150502[22] Luers, J. K. (1997). Temperature Error of the Vaisala RS90 Radiosonde, Journal of Atmospheric and Oceanic Technology, 14(6), 1520-1532. Retrieved Feb 24, 2022, from
https://journals.ametsoc.org/view/journals/atot/14/6/1520-0426_1997_014_1520_teotvr_2_0_co_2.xml
[23] Mears, C. A., Wentz, F. J., Thorne, P., and Bernie, D. (2011), Assessing uncertainty in estimates of atmospheric temperature changes from MSU and AMSU using a Monte-Carlo estimation technique, J. Geophys. Res., 116, D08112, doi:10.1029/2010JD014954.
%20(2).png)


Comments
Post a Comment