Posts

Responding to the CO2 Coalition's "Fact #12" on Sea Level Rise

Image
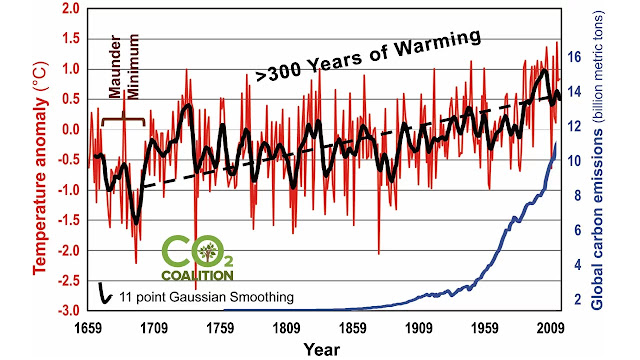
CO2 Coalition 's " Fact #12 " asserts that global sea levels rose before CO2 levels started to increase. They say, "The evidence shows that the global warming causing the rise in sea levels and the retreat of the glaciers began long before any significant man-made CO2 increases could have influenced either. ... That glacial 'tipping point' occurred around 1800, with full-on retreat by 1850. Thus began more than 150 years of worldwide glacial retreat and sea-level rise that continues at about the same rate today as 150 years ago." They cite Jevrejeva et al 2014[1] in support of this, and they produced their own version of a graph supposedly taken from that paper, complete with a picture of a rock hammer. Why not? So of course I tracked own Jevrejeva et al 2014 to see if their claims are backed up by the paper they chose to use to support them. Here's the graph from the paper below. As you can see, the paper goes back to 1700, and the 1-sigma confidenc...

Responding to the CO2 Coalition's "Facts #19, #20, and #28" on Geologic Temperature Changes

Image
CO2 Coalition seems to think it needs to say almost the same thing three times in slightly different ways. In " Fact #19 ," " Fact #20 " and " Fact #28 " they said in various ways that global temperatures have changed a lot across geologic history, and current temperatures are colder than most of geologic history. While these things are generally true, they are also completely irrelevant to whether humans are changing global temperatures through our carbon emissions and whether that is causing harm for human civilization and biodiversity. There are still several misleading things being said in these three "facts," beginning with the choice of graph. CO2 Coalition shows some version of the above graph in all three of these "facts," claiming it comes from "Scotese (2002)." This gives the impression they got this from a scientific paper, but it's not. It's a schematic that Christopher Scotese put on a website over 20 ye...

Responding to the CO2 Coalition's "Fact #27" on Post WWII Temperatures

Image
CO2 Coalition 's " Fact #27 " depends almost entirely on cherry picking. Here we're told that for 33 years, global temperatures cooled while CO2 emissions increased. "We have seen that the beginning of the modern increase in CO2 emissions began in the post-WW II industrial boom. Yet that great rise in CO2 was accompanied by a significant 33-year span of global cooling from 1944–1976. If CO2 is the primary driver of modern temperature change, why did temperatures actually fall during this time span?" Here's the graph they posted. I'll answer their question after clarifying the issues here. The graph above contains numerous problems. First, they posted monthly temperature anomalies from HadCRUT4 (which is out of date) and annual emission CO2 emission values for 1944-1976. The decision compare monthly temperatures to annual emissions appears to be an attempt to exaggerate the differences between the two. CO2 Coalition should have used annual values for ...

Responding to the CO2 Coalition's "Fact #10" on When Modern Warming Began

Image
CO2 Coalition 's " Fact #10 " claims that what they call "modern warming" began more than 300 years ago. In their words, "the current warming trend we are in began in the year 1695. The next 40 years had more than twice the rate of warming as we experienced in the 20th century. The first half of this 300-plus year warming had about the same amount of temperature rise as the latter half and was entirely naturally driven." The graph they use to support this claim is below. You may be noticing some recurring themes in the CO2 Coalition bag of tricks - in this case, to use local temperatures in place of global temperatures. They use Central England Temperatures (HadCET) instead of GMST datasets (either proxies or the instrumental record).  HadCET isn't terribly reliable even for Central England during the early years of the dataset, and especially prior to 1772.[1] But data quality issues aside, Central England isn't and never has been the globe. T...

Responding to the CO2 Coalition's "Facts #17 and #26" on Whether Current Warming is Unprecedented

Image
CO2 Coalition 's " Fact #17 " and " Fact #26 " are parts 2 and 3 of an apparent rebuttal of the fact that "current warming" is unusual and "unprecedented" since the beginning of the Holocene. Part 1 (Fact 16) was an attempt to deal with Holocene temperatures. Parts 2 and 3 attempt do deal with temperatures over the last 2000 years, whether using Moberg 2005 (Fact 17)[1] or Loehle 2008 (Fact 26)[2]. I'm including both together here because both of these "facts" have the same fatal flaw - both eliminated "current warming" from their graphs. It should seem pretty obvious to most that you can't show that current warming is neither unusual nor unprecedented over the last 2000 years if you first cut out current warming from consideration. Here's how CO2 Coalition  "hides the incline" in their plot of Moberg 2005. CO2 Coalition says from this that "this chart by Moberg et al is a multi-proxy paleo temp...

Responding to the CO2 Coalition's "Facts #13 and #16" on Whether Current Warming is Unprecedented

Image
CO2 Coalition 's " Fact #13 " and  " Fact #16 " are essentially identical. Fact 13 claims that temperatures changed dramatically before human activity, and Fact 16 claims current warming isn't unprecedented. Both use the same graph. Fact 16 claims to be the first of three parts, but these parts aren't given sequentially. The other two of the three parts are " Fact #17 " and " Fact #26 ." These two "facts" are (like many others) lifted from Gregory Wrightstone's self-published book, which I've reviewed elsewhere. The text of this "Fact 16" is not identical to the book, but the content is basically the same, and some of it directly quotes the book. We're told that the current warming period is "very similar to nine other warming trends of the last 10,000 years. For more than 6,100 years (or 60%) of the current interglacial warm period, the temperature was warmer than it is today. Of the nine earlier...

Responding to the CO2 Coalition's "Facts #6 and #7" on CO2 Concentrations on Geologic Time Scales

Image
CO2 Coalition 's " fact #6 " and " fact #7 " are essentially identical, and both are largely just a rehash of statements made in previous "facts." Here we're told that "our current geologic period, the Quaternary, has seen the lowest average levels of carbon dioxide since the Precambrian." To support this claim, they took the data from the climate model in Berner 2001 and averaged all the CO2 concentration values for each Geologic period, ignoring the confidence intervals and the length of the period, and plotted the following graph. Note that each geologic period is shown as if they were the same length. As I've already shared , CO2 proxies often paints a somewhat different picture from Berner 2001's climate model. The model has been updated several times since 2001, but the CO2 Coalition  appears to be completely unaware of this. Here again is the proxy evidence we have for CO2. It's pretty sparse before the proliferation of...