Posts

Showing posts from February, 2022

Which Satellite Temperature Time Series is More Accurate?
Image
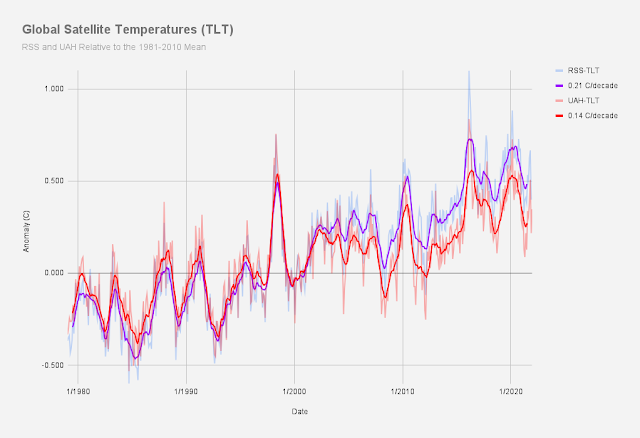
RSSv.4.0 and UAHv.6.0 Satellite Temperatures In a previous post , I summarized the most important reasons why the instrumental record is more accurate than satellites, and I showed that there is far more disparity between satellite datasets than there are among GMST datasets. In this post, I'd like to examine the satellite datasets to see if we can say to what extent some are more accurate than others. There are several satellite datasets, but three (RSS, UW and NOAA) strongly agree with each other, while the dataset from UAH is the outlier of the four. Keep in mind that in general all four of these use the same satellites So for the sake of simplicity, I'm going to simply compare RSS and UAH.  University of Alabama Huntsville (UAH) The UAH dataset is maintained by John Christy and Roy Spencer. For better or for worse, these scientists have strong disagreements with many of the conclusions of mainstream climate scientists. And at least in the opinion of many, perhaps not coinci...

The Marketing of Alt-Data at Temperature.Global

Image
Temperature.Global (12-month running average, sort of) A few years ago, I started seeing people post links to a new dataset for global temperatures at a website called temperature.global. There are at least four unique features of this dataset. First, the website claims to update global temperature in near real time. Second, every year in the dataset averages below "normal." Third, there is absolutely no transparency regarding their methodology (those who administer it are anonymous, most of the data is hidden, and much of their methodology is unclear). And fourth, what is disclosed about their methodology reveals that what they are calculating is not the Earth's surface temperature. Description of Temperature.Global If you go to the temperature.global website, it becomes almost immediately apparent that this website has little concern for transparency. The website is hosted by Parler (the alternative social network), which if nothing else is pretty odd. There are no name...

Review of Inconvenient Facts, Part 1 - CO2 & Paleoclimate

Image
This is part 1 of a two part book review.  A few years ago, a man named Gregory Wrightstone appeared in several of the Facebook groups I participate in. He participated in debates with other members over issues related to climate change, frequently using graphs that he had made. It turns out he was working on a book, and as best I can tell, he was testing his content in debate groups to hear objections to his claims before self-publishing the book. That's a bit of speculation on my part, but I noticed that his book sometimes was changed from what he had posted in the discussion groups, and I like to think that he altered his arguments as a result of conversations with others. He self-published his book under the sufficiently political title, Inconvenient Facts: The Science Al Gore Doesn't Want You to Know .[1] The not-so-subtle implication here is that Al Gore misrepresented the facts and science of climate change and doesn't want you to be informed, but Mr. Wrightstone is...

Effects of AGW on Wildfires in the Western U.S.

Image
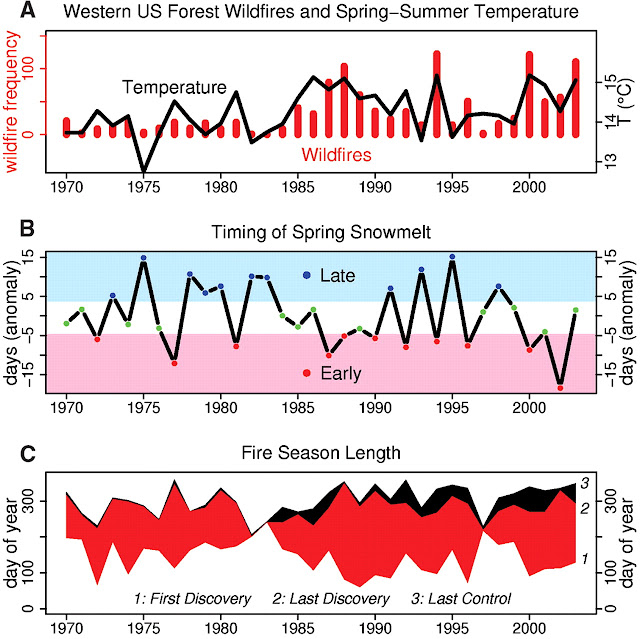
Relationship Between Temperature and Wildfire Frequency, Season Length and Spring Snowmelt This is part 2 of a two-part series on wildfires in the U.S. Here's part 1 , where I look at the evidence for how wildfires have increased in the U.S.   By all accounts the relationship between wildfires and climate change is complex. In fact, it's probably fair to say there are to some extent two competing trends globally. Warmer temperatures from increased GHGs lead to more water vapor in the atmosphere which should increase rainfall in some areas of the world. But in more arid climates, like in the western U.S., warmer temperatures can increase aridity. Increased vapor pressure deficit (VPD) leads to decreases in soil moisture; plants dry out and become flammable more quickly, so wildfires can ignite and spread more quickly. This is not to say that AGW actually starts wildfires. Sources of ignition are still predominantly human behavior (as in carelessness with cigarettes and camp fire...

Wildfire Statistics in the United States

Image
This is part 1 of a three-part series on wildfires in the western U.S. Here's part 2 , where I delve into more of the geographical statistics on unprotected lands. And here's part 3 , where I examine the evidence regarding the impact AGW is having on wildfires in the American West. The above graph above shows the increase in western U.S. wildfire acres burned since 1984 as well as the amount of increase that is estimated to be due to climate change. The paper it comes from[1] estimates that climate change has roughly doubled the acres burned in the western U.S. beyond what we would be experiencing without climate change. The reasoning here is complex, but what I want to do in this post is talk about the statistics themselves. The above graph comes from data published in a peer-reviewed paper[1] and shows up in the 4th National Climate Assessment,[9] but it has been heavily criticized for cherry picking.[7] We're told if we go back to the early 20th century, we'll get a ...