Posts

Why Do Climate Scientists use 15°C for Current GMST?

Image
There's a conspiracy theory floating around the blogosphere and social media that argues (oddly) that climate scientists manufactured global warming by artificially lowering global temperatures. The "thinking" goes like this. Back in 1896, Svante Arrhenius calculated global mean surface temperature (GMST) to be 15°C. Following this, other scientists confirmed this value for later years. For instance, Hansen is reported to have claimed that value in 1981. The first IPCC report is claimed to confirm it again in 1990. In some incarnations of this conspiracy theory use other sources using 15°C, but the concept is the same. Then, after the so-called "pause" began in 1998, scientists needed another way to manufacture global warming, so they lowered GMST to 14°C so that they could increase it again. If that sounds confusing to you, it should. It doesn't make any sense. But let's unpack what's actually going on. Arrhenius' Calculation in 1896 Svante Arr...

Responding to the CO2 Coalition's "Facts #8 and #9" on US and Plant Growth with More CO2

Image
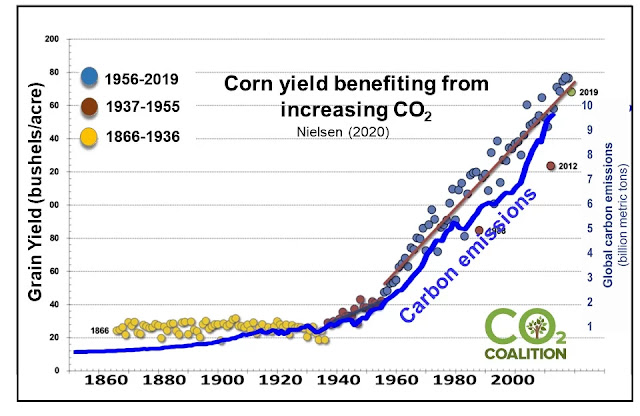
CO2 Coalition 's " Fact #8 " and " Fact #9 " want us to believe that more CO2 means more plant growth (Fact 8) and allow crops to feed more people globally (Fact 9). The claims here are not really new compared to other claims in this list of "facts," and we've already seen why these claims are misleading at best. We've seen in two posts ( here and here ) that increasing CO2 doesn't just cause greening through CO2 fertilization but also warming through the greenhouse effect. The latter increases heat stress for plants and limit their ability to make use of additional CO2 for photosynthesis. We've also seen here that CO2 Coalition just assumes that increases in corn yields are due to increased CO2 when the sources they cite actually attribute increases in crop yields to better hybrid corn and better technology. The logic of these facts is very similar. In "fact 9," we're shown a graph of grain production with CO2 and tempe...

Responding to the CO2 Coalition's "Facts #29, #30 and #31" on US and Global Droughts

Image
  CO2 Coalition 's " Fact #29 ," " Fact #30 " and " Fact #31 " are essentially the same strawman attacks having to do with claims about droughts that nobody is actually saying. They basically observe here that there has been no change in droughts in the US, and droughts are declining globally. Here are the graphs they use to support this point. And yet who said otherwise? It's well-documented that warmer air holds more water, with water vapor increasing by ~7% for every 1 C warming. So on average, we should expect to see decreases in droughts as a global average. CO2 Coalition is attacking as strawman here. Climate scientists also observe that in more arid areas with less water availability, warming increases vapor pressure deficit (VPD) which should drive local and regional increases in the frequency and intensity of droughts (I cover more about this here ). This is observed in the American Southwest and in other areas around the world. In wetter...

Responding to the CO2 Coalition's "Fact #25" on CO2 and Soil Moisture

Image
CO2 Coalition 's " Fact #25 " claims that increasing CO2 causes moister soil. We're told that increasing CO2 concentrations means that plant stomata are open for shorter periods, so plants become more efficient (water use efficiency or WUE increases) and don't take as much water from soils. From this they claim that "CO2 fertilization has been linked to decreases in global fire, drought and heat waves." It's true that studies have shown that in some ecosystems, elevated CO2 has been linked to better water use efficiency (WUE) and improved soil moisture. But CO2 Coalition is being a bit selective in the information they present, even in the two examples they provide. In their first example, they cite research from CSIRO that showed that increasing CO2 has lead to a boost in green foliage in desert areas, but there are also secondary effects: "On the face of it, elevated CO2 boosting the foliage in dry country is good news and could assist forest...

Responding to the CO2 Coalition's "Fact #23" on Corn Yields

Image
CO2 Coalition 's " Fact 23 " claims that "CO2 increase is enhancing corn production" by a lot. This is such an astounding fact that CO2 Coalition devoted a whole sentence to defend its claim. "In the United States, corn production (bushels per acre) is steadily increasing as CO2 levels increase. This steady and continued increase cannot be explained simply by better technology." Here's the graph they show to support this from Nielson 2020 , which is an article posted on Purdue's website. The article says nothing about CO2. Instead, it says that corn yields were positively affected by several "miracles" that resulted in three stages of corn yields. Corn yields were stagnant from 1866-1936 until the rapid adoption of hybrid corn. Rapid adoption of double-cross hybrid corn by American farmers began in the late 1930's, in the waning years of the U.S. Dust Bowl and Great Depression. Within a very few years after that, the national yiel...

Responding to the CO2 Coalition's "Facts #22 and #24" on Ideal Temperature

Image
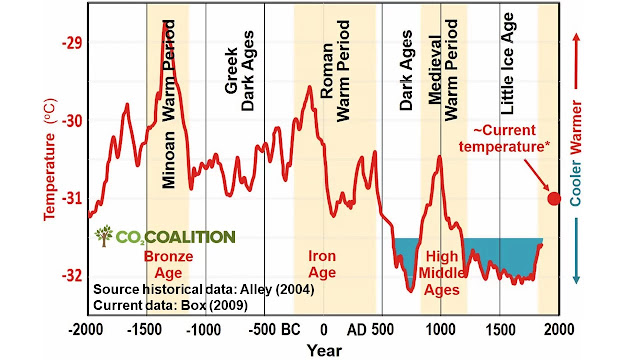
CO2 Coalition 's " Fact #22 " and " Fact #24 " are designed to make you think that warm is better than cold for global temperatures and climate scientists like Michael Mann we should return the Earth's temperature to an "ideal" temperature during the Little Ice Age (LIA). In their "fact #22," they claim that "The most dramatic advances in civilization took place during the last four warm periods—including our own. The advancement of science, technology and the arts have been directly linked to warmer weather." To support this, they show a graph of Greenland Summit temperatures from the GISP2 ice core.   I've  pointed out elsewhere  many of the problems they have when they use this graph to confuse local with global temperatures and misplot "current temperatures" from Box 2009. But here they add another layer of confusion to the claims they've made before because none of these "advancements in science, tech...

Responding to the CO2 Coalition's "Fact #21" on Climate Models

Image
CO2 Coalition 's " Fact #21 " claims that "IPCC models have overstated warming by up to three time too much." According to this claim to fact, John Christy's testimony on "February 2016 to the U.S. House Committee on Science, Space & Technology included remarkable charts that document just how much the models overestimate temperatures. The red line in the chart shows the average of 102 climate model runs completed by Christy and his team at the University of Alabama at Huntsville using the models on which the IPCC itself relies. Also shown on the chart are the actual, observed temperatures. The models exaggerate warming, on average, two and a half times the actual temperature (or three times over in the climate-crucial tropics). Here's the graph they use to support this claim. The above graph reports to show 32 models and 102 model runs within the CMIP5 model ensemble. They are limited to those runs in the KNMI Climate Explorer. The models are s...