Responding to the CO2 Coalition's "Fact #23" on Corn Yields
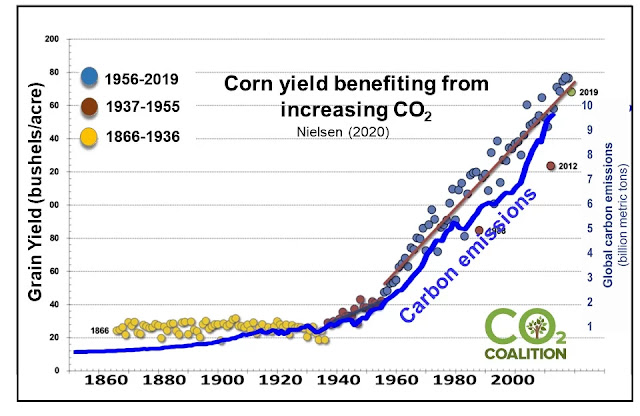
CO2 Coalition's "Fact 23" claims that "CO2 increase is enhancing corn production" by a lot. This is such an astounding fact that CO2 Coalition devoted a whole sentence to defend its claim. "In the United States, corn production (bushels per acre) is steadily increasing as CO2 levels increase. This steady and continued increase cannot be explained simply by better technology." Here's the graph they show to support this from Nielson 2020, which is an article posted on Purdue's website.
The article says nothing about CO2. Instead, it says that corn yields were positively affected by several "miracles" that resulted in three stages of corn yields. Corn yields were stagnant from 1866-1936 until the rapid adoption of hybrid corn.
Rapid adoption of double-cross hybrid corn by American farmers began in the late 1930's, in the waning years of the U.S. Dust Bowl and Great Depression. Within a very few years after that, the national yield estimates indicated that a genuine "miracle" of corn grain yield improvement had occurred. The annual rate of yield improvement, which heretofore had been about zero, increased to about 0.8 bushels per acre per year from about 1937 through about 1955.
Then the second "miracle" occurred in the 1950s and continues to improve corn yields until 2019. This second "miracle" occurred
in response to continued improvements in genetic yield potential and stress tolerance plus increased adoption of nitrogen fertilizer, chemical pesticides, agricultural mechanization, and overall improved soil and crop management practices. The annual rate of corn yield improvement more than doubled to about 1.9 bushels per acre per year and has continued at that steady annual rate ever since, sustained primarily by continued improvements in genetics and crop production technologies.The article continues to say that "USDA-NASS yield data show little to no evidence that the yield trend over the past 25 years has deviated from the long-term 1.9 bushels per acre per year." So to summarize, CO2 Coalition supported their claim that the increase in corn yields "cannot be explained simply by better technology" with an article that claims that the increase in corn yields is essentially entirely explained by better technology. Corn yield rates have not changed despite increased carbon emissions over the last 25 years. Below is the graph that shows up in the article cited by the CO2 Coalition. There is no attribution to CO2 emissions in the article.
References:
[1] S. Irmak, R. Sandhu, M.S. Kukal, Multi-model projections of trade-offs between irrigated and rainfed maize yields under changing climate and future emission scenarios, Agricultural Water Management, Volume 261, 2022, 107344. https://doi.org/10.1016/j.agwat.2021.107344.
https://www.epa.gov/sites/production/files/2018-01/documents/2018_complete_report.pdf.
[3] Zampieri, M., A. Ceglar, F. Dentener, and A. Toreti, 2017: Wheat yield loss attributable to heat waves, drought and water excess at the global, national and subnational scales. Environmental Research Letters, 12 (6), 064008. doi:10.1088/1748-9326/aa723b.
[4] Zhao, C., B. Liu, S. Piao, X. Wang, D. B. Lobell, Y. Huang, M. Huang, Y. Yao, S. Bassu, P. Ciais, J.-L. Durand, J. Elliott, F. Ewert, I. A. Janssens, T. Li, E. Lin, Q. Liu, P. Martre, C. Müller, S. Peng, J. Peñuelas, A. C. Ruane, D. Wallach, T. Wang, D. Wu, Z. Liu, Y. Zhu, Z. Zhu, and S. Asseng, 2017: Temperature increase reduces global yields of major crops in four independent estimates. Proceedings of the National Academy of Sciences of the United States of America, 114 (35), 9326–9331. doi:10.1073/pnas.1701762114
[5] Marshall, E., M. Aillery, S. Malcolm, and R. Williams, 2015: Climate Change, Water Scarcity, and Adaptation in the U.S. Fieldcrop Sector. Economic Research Report No. (ERR-201). USDA Economic Research Service, Washington, DC, 119 pp. URL.
[6] Kimball, B. A., J. W. White, G. W. Wall, and M. J. Ottman, 2016: Wheat responses to a wide range of temperatures: The Hot Serial Cereal Experiment. Improving Modeling Tools to Assess Climate Change Effects on Crop Response. Hatfield, J. L., and D. Fleisher, Eds., American Society of Agronomy, Crop Science Society of America, and Soil Science Society of America, Inc., Madison, WI, 33–44. doi:10.2134/advagricsystmodel7.2014.0014.
[7] Beach, R. H., Y. Cai, A. Thomson, X. Zhang, R. Jones, B. A. McCarl, A. Crimmins, J. Martinich, J. Cole, S. Ohrel, B. DeAngelo, J. McFarland, K. Strzepek, and B. Boehlert, 2015: Climate change impacts on US agriculture and forestry: Benefits of global climate stabilization. Environmental Research Letters, 10 (9), 095004. doi:10.1088/1748-9326/10/9/095004.
[8] Schauberger, B., S. Archontoulis, A. Arneth, J. Balkovic, P. Ciais, D. Deryng, J. Elliott, C. Folberth, N. Khabarov, C. Müller, T. A. M. Pugh, S. Rolinski, S. Schaphoff, E. Schmid, X. Wang, W. Schlenker, and K. Frieler, 2017: Consistent negative response of US crops to high temperatures in observations and crop models. Nature Communications, 8, 13931. doi:10.1038/ncomms13931.


Comments
Post a Comment