Responding to the CO2 Coalition's "Fact #11" on Mountain Glacier Melting
CO2 Coalition's "Fact #11" (together with "Fact #12") claim that a "tipping point" occurred in 1800 that caused mountain glaciers to melt (and sea levels to rise), and since this "tipping point" occurred before major increases in CO2, both the glacial melting and sea level rise "are directly the result of the natural warming that began in the late 17th-century." They assert that glacial retreat (and sea level rise) "continues at about the same rate today as it was 150 years ago." The graph they use to support this claim was taken from Oerlemans 2005[1] with their own annotations.
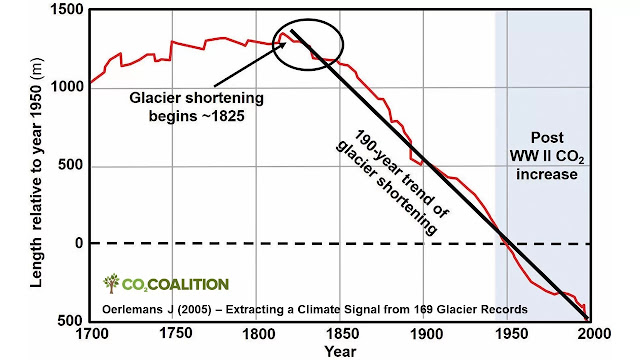 The paper they reference is pretty interesting, though there is absolutely no claim in the paper of any "tipping point" in 1800, and the "190-year trend of glacier shortening" is an annotation of CO2 Coalition, not a claim of the paper.
 The actual graph from the paper shows no "tipping point" but a gradual acceleration of glacier shortening following 1850. The paper goes beyond this to reconstruct global temperatures from changes in glacial length. The resulting graph in the paper looks distinctively "hockey stick" shaped with relatively flat temperatures from 1700 to 1850, gradual warming from 1850 to 1910 and rapid warming following 1910 with a "pause" following World War II corresponding to "global dimming" due to increased aerosol pollution following WWII.
 I find it interesting that CO2 Coalition hid the fact that the paper they cited used glacial length as further support for the "hockey stick." The paper concludes,
  And of course the accelerated rates of glacial shortening following 1910 directly contradicts CO2 Coalition's claim that glacial shortening "continues at about the same rate today as it was 150 years ago."
 Another paper[2] publish in 2021 conducted an inventory of the mass balance of the various forms of ice in the cryosphere. The above chart shows an acceleration of mass loss from mountain glaciers. The paper represents this visually in the graph below. Certainly we can say that there is an acceleration of mass loss in mountain glaciers and all grounded ice.
 The data flatly contradicts the claims of the CO2 Coalition, and that includes evidence from the paper they cited to support their claim in this "fact."
References:
[1] Oerlemans J (2005) Extracting a Climate Signal from 169 Glacier Records. Science 29 Apr 2005: Vol. 308, Issue 5722, pp. 675–677 DOI: 10.1126/science.1107046

It should be stressed that the temperature reconstruction presented here is fully independent of other sources (proxy or instrumental). It thus provides complementary evidence on the magnitude of the current global warming, on the time that this warming started, and on the fact that in the lower troposphere the warming appears to be independent of elevation.
The supplementary material actually includes a graph comparing the reconstruction from glacial retreat with Mann's proxy reconstruction. This paper actually shows slightly more warming than is reconstructed by Mann et al.
References:
[1] Oerlemans J (2005) Extracting a Climate Signal from 169 Glacier Records. Science 29 Apr 2005: Vol. 308, Issue 5722, pp. 675–677 DOI: 10.1126/science.1107046
[2] Slater, T., Lawrence, I. R., Otosaka, I. N., Shepherd, A., Gourmelen, N., Jakob, L., Tepes, P., Gilbert, L., and Nienow, P.: Review article: Earth's ice imbalance, The Cryosphere, 15, 233–246, https://doi.org/10.5194/tc-15-233-2021, 2021.


Comments
Post a Comment