Posts

How Natural Carbon Sinks Respond to Carbon Emissions

Image
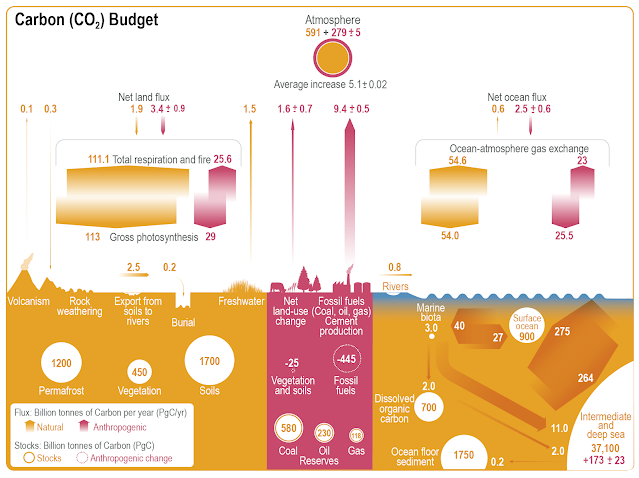
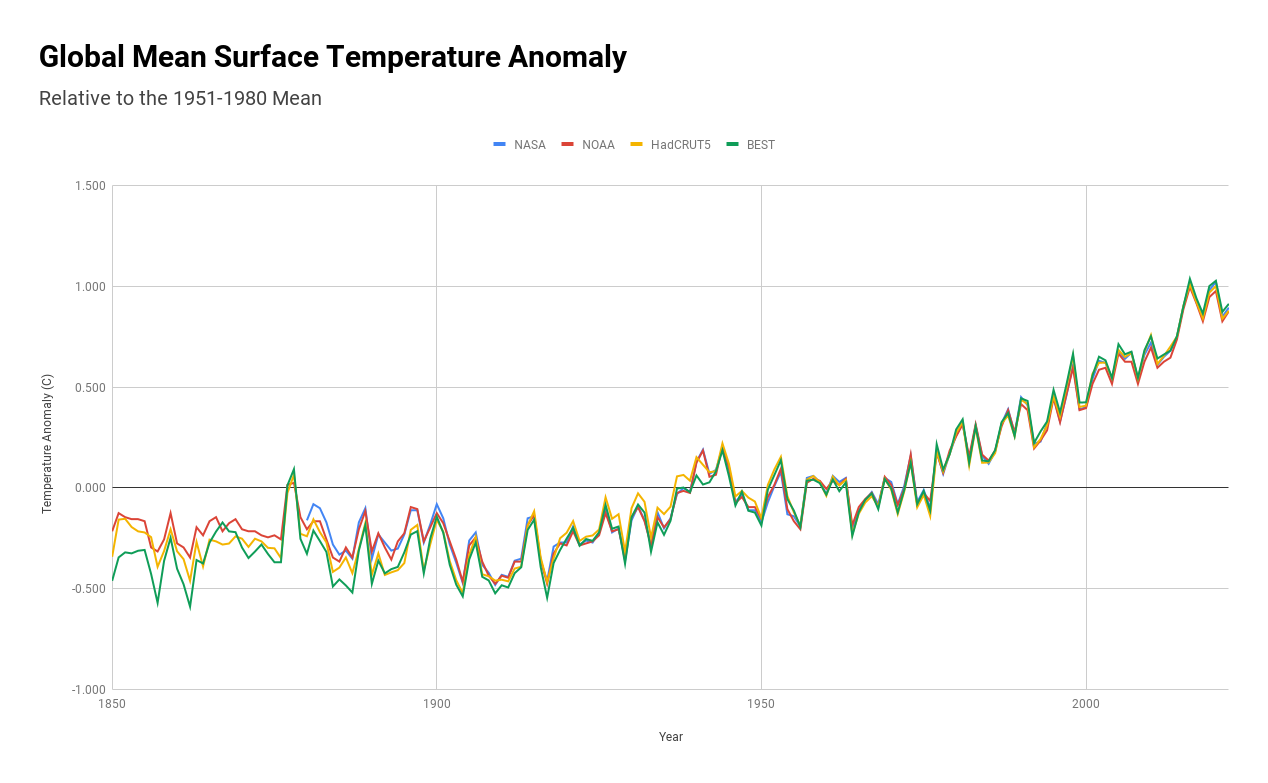
In a previous post , I evaluated a recently published MDPI paper claiming that we could with minimal effort limit CO2 concentrations to 475 ppm and warming to 1.5 C above preindustrial levels. The paper was horribly flawed, but it was based on the assumption that natural sinks will increase more rapidly than our continued emissions. I thought it would be an interesting exercise how scientists expect natural sinks to respond as CO2 concentrations (and global temperatures) increase. I want to show expected changes in sinks as CO2 concentrations rise. As noted in that previous post, the 2021 carbon budget values are estimated per year, and converting these values so that they reflect the size of sinks in terms of atmospheric CO2 concentrations potentially introduces biases into the data. I do not want to go into a lot of detail. Instead I want to cover the land and ocean sink in general terms. I'm also only considering the impact of CO2 without evaluating the effect of increases in ot...

Will CO2 Concentrations Stabilize without Drastic Emission Reductions?

Image
A paper was published recently in an MDPI journal Atmosphere [1] by Joachim Dengler and John Reid (DR) that aims to show that we can keep global temperatures from eclipsing the 1.5 C target "if we keep living our lives with the current CO2 emissions – and a 3%/decade efficiency improvement."[2] I saw this paper highlighted on Judith Curry's blog , so I figured it deserved some attention. The basic argument is that the amount of absorbed CO2 increases with CO2 concentration, such that at 475 ppm CO2 we will achieve net zero emissions - natural sinks will absorb 100% of our emissions and CO2 concentrations will stabilize if we improve our efficiency at 3% per decade. And if this occurs, GMST will stabilize at 1.4 C above preindustrial levels, keeping us below the 1.5 C thresholds from the Paris Agreement and IPCC targets. This is a really odd paper. DR begin by acknowledging that a big portion of understanding how our carbon emissions affects climate depends on what percent...

When Will We Cross IPCC Targets?

Image
Recently NOAA released v. 5.1 of their global GMST dataset and, aside from adding full global coverage, it extended the dataset back to 1850. This gives us a third GMST dataset that goes back to 1850. Since the IPCC uses the 1850-1900 mean as a baseline to represent "preindustrial" temperatures, this gives us three datasets to use to calculate the amount of warming we've experienced above preindustrial levels. The IPCC has set a target of +1.5°C above preindustrial temperatures, where +1.5°C is a 30-year average above the 1850-1900 mean. The IPCC estimates that 2011-2020 averaged +1.1°C above preindustrial levels. But the question I have is, where are we now, and when will we cross the +1.5°C and +2.0°C targets if we continue warming at current rates? To answer this question, I took the data I've already downloaded from NOAA (monthly), HadCRUT5 (monthly) and Berkeley Earth (annual). The NOAA dataset is current through January 2023 and the other two are current through...

Bias Correction in Surface Thermometer Datasets

Image
Virtually all temperature datasets that have been around for a significant amount of time depend on surface thermometers, most of which were not designed to measure climate changes; they were positioned to collect meteorological data for temperature and precipitation, and many of these stations have been maintained by volunteers. In earlier years there was no standardized process for even when temperatures were recorded. Daily temperatures were calculated using max-min thermometers that recorded the "max" and "min" temperatures recorded by the thermometer since the last time it was checked and reset. If the thermometer was checked daily, this would give data for daily highs and lows. The average temperature for the data as calculated simply by Tavg = (Tmax + Tmin)/2. Biases can easily enter into the temperature record by systematic changes in 1) time of observation , 2) instrument technology, and 3) urbanization, as well as other factors. Likewise, sea surface tempe...

Skepticism vs Alarmism

Image
In a previous post , I considered the rise of pseudo-skepticism in much of current contrarian movements. At the heart of pseudo-skepticism is using what is demonstrably wrong as justification for the rejection of known evidence and well-established science; in order to explain the fact that virtually all the evidence disagrees with you, you need a conspiracy to explain the contradictory evidence away. So "flat earthers" say that because "you can see too far" and "water seeks its level" the earth must be flat, and physics and geology and maps and common sense are all wrong. That means NASA must be doctoring photographs of the earth, air traffic is faked, and nobody has ever been to Antarctica. Most people are "sheeple" who are simply not skeptical enough to see through all the lies and evidence and data and common sense to know that everyone in authority is lying to us. This kind of thinking can only be sustained with a well-developed confirmatio...

Skepticism vs Pseudoskepticsm

Image
The image below is a fake image. It's reported to be an image of a rainbow that was posted on the David Attenborough Club  (apparently maintained by Hasan Jasim) and attributed to Lloyd Ferraro . According to at least one source, Lloyd Ferraro is a pilot who took this image at 30,000 ft while flying a plane. "According to Ferraro, he was flying over the Pacific Ocean when he spotted the rainbow and decided to capture the moment on camera. The resulting photograph has since gone viral, captivating people around the world with its beauty and rarity." However, there is no doubt that the rainbow in this image is photoshopped or (perhaps more likely) AI-generated .  There are at least three ways we know this is the case. First, we see rainbows when looking in the direction of our shadow. It's not possible to see a rainbow when the sun is in front of you, as is basically the case in this image. Second, the primary red ring of a rainbow forms at a 42° angle, relative to yo...