Satellite Data Tampering by John Shewchuk
The graph below from John Shewchuk is intended to show that models predict too much warming compared to satellite data. Shewchuk claims that the red line is the average of 102 IPCC CMIP5 model runs for the surface through 50K feet. In all likelihood, this is just lifted from graphs of model-observation comparisons that John Christy has plotted in the past. Shewchuk claims the blue line is UAH satellite observations for the total troposphere layer (TTT).

The problems with this graph are numerous, and many of the problems are inherited from Christy's graph (problems with his comparison are well-documented). The two time series are separated from each other even in 1980 to exaggerate the differences between the two (even if the trendlines do intersect at 1980). The 102 model runs are not shown, only the model mean, and the 95% confidence interval is also not shown, so we have no idea what the spread in the model runs might be. But Shewchuk has added his own dishonest twist to this graph that to my knowledge even Christy has never done. What he calls UAH's "entire tropospheric layer" (TTT) doesn't appear to be that at all.
.png) |
| Note Shewchuk's Apparent Fudging of the Data before 1982 and after 2020 |
UAH does not publish TTT. They publish lower troposphere (TLT), mid-troposphere (TMT) and the tropopause (TTP). Shewchuk has combined these in some fashion to produce his graph. I've asked him twice to explain how he did this, but he hasn't answered (he told me to consult AI). It looks very much like he took an average of the monthly values for the three datasets and plotted a 60-month running mean of the average, then he apparently fudged the beginning and end of the time series (before 1982 and after 2020) to exaggerate the differences between them. Even aside from the apparent fudging, assuming TTT = (TLT+TMT+TTP)/3 is wrong; these layers strongly overlap. These are the weighting functions for UAH.
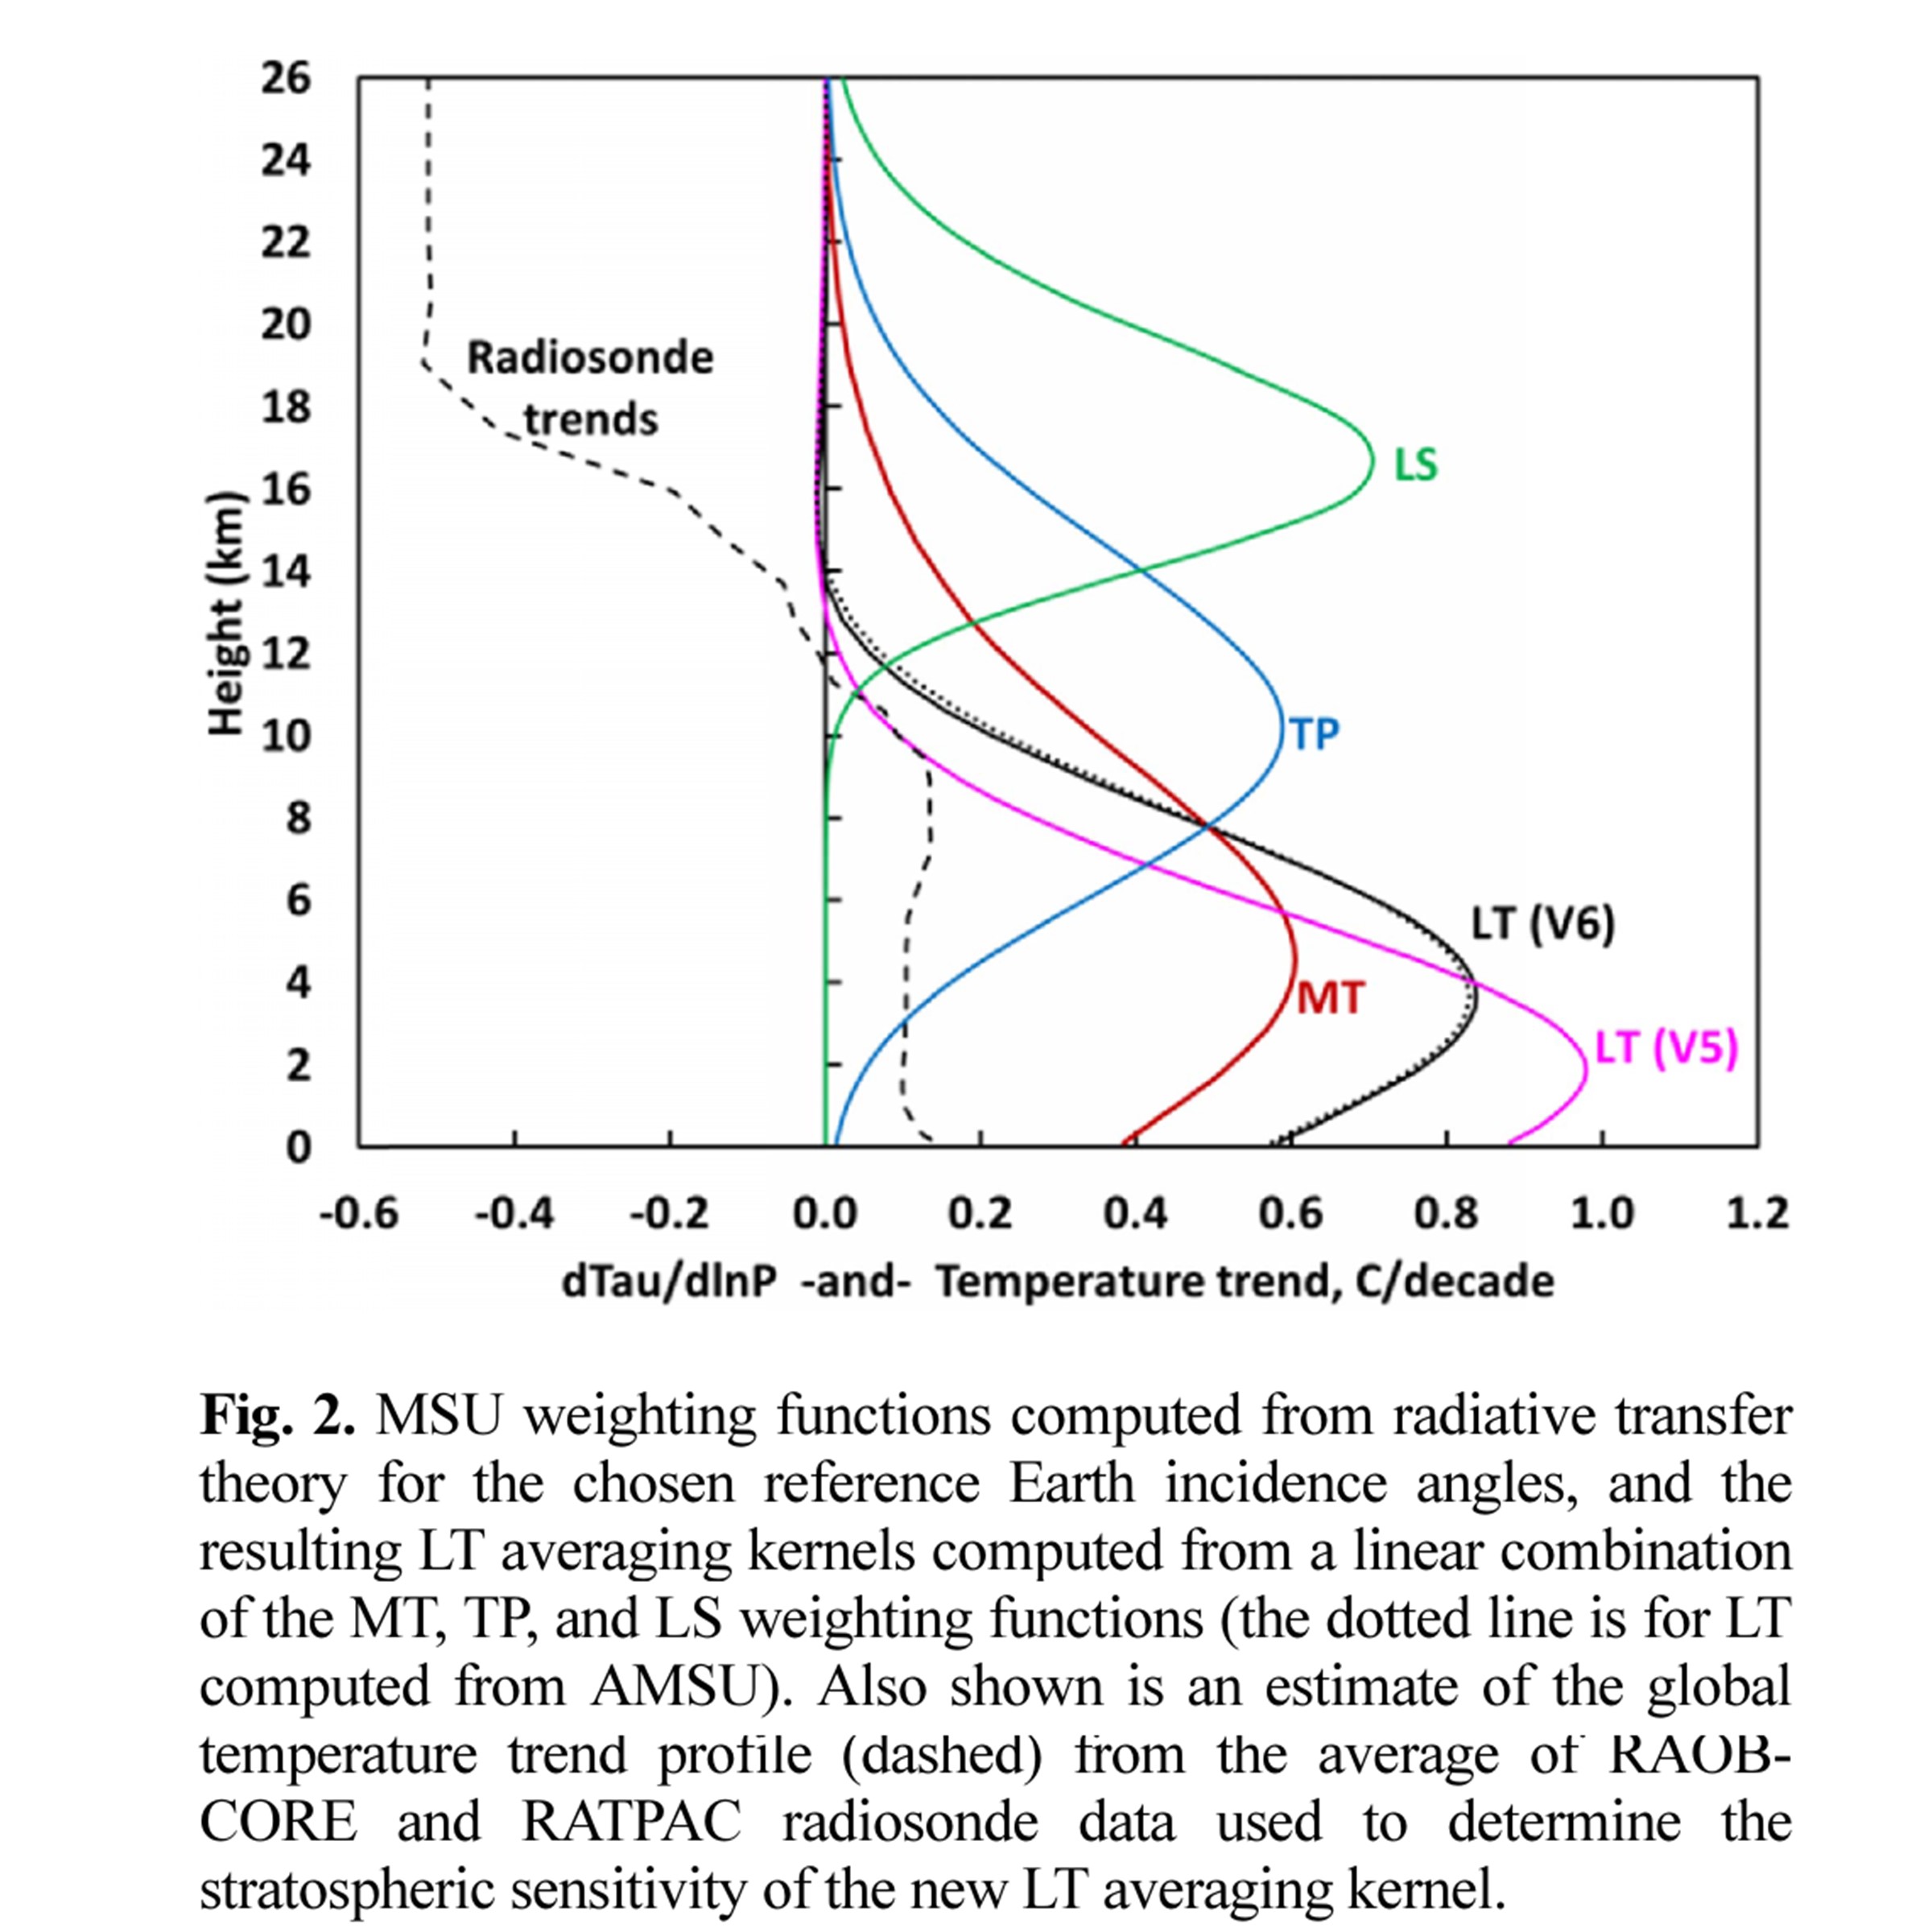
Clearly with all this overlap, just averaging TLT, TMT and TTP is wrong. Unless and until he explains and justifies how he came up with this graph, this looks convincingly like another excellent example of Shewchuk's data tampering. So I decided to fix it.
%20(3).png)
Shewchuk's plot of model runs only goes through 2022 (because that's how far the original from Christy went), so I only show the model mean through what he plotted above. Since RSS does publish TTT temperatures, I took RSS-TTT and the Christy/Shewchuk plot 102 CMIP5 models, and I plotted both with respect to a 1981-1990 baseline. It turns out that if you plot both Shewchuk's model mean and RSS-TTT temperatures accurately, the agreement is much greater than what is suggested in Shewchuk's plot. Now to be clear, the trends in each are a little different. The Christy/Shewchuk model trend is 0.23°C/decade for 1980-2022, and the RSS-TTT trend is 0.19°C/decade for 1979 to May 2025 (and UAH tends for the troposphere are generally lower than RSS trends). However, a proper plot of actual TTT data shows better agreement with the models than the graph with Shewchuk's tampering shows. Total troposphere temperature (TTT) actually does agree pretty well compared to the Christy/Shewchuk plot of CMIP5 models. It's Shewchuk's data tampering that causes most of the apparent mismatch.

%20(2).png)


Comments
Post a Comment