Posts

Showing posts from January, 2024

Roy Spencer on Models and Observations

Image
A few days ago, Dr. Roy Spencer wrote a piece for the Heritage Foundation called, " Global Warming: Observations vs. Climate Models " ( PDF ) essentially arguing that models show too much warming compared to observations, and if we stick to observations, "global warming offers no justification for carbon-based regulation." He claims to frame his argument in terms of answering three questions: Is recent warming of the climate system materially attributable to anthropogenic greenhouse gas emissions, as is usually claimed? Is the rate of observed warming close to what computer climate models—used to guide public policy—show? Has the observed rate of warming been sufficient to justify alarm and extensive regulation of CO2 emissions? We should keep in mind that this is a political document intended to support the political aims of the Heritage Foundation, and Spencer has carefully selected what he says and doesn't say to fit the political agenda of the Heritage Found...

Gross Incompetence and Trickery at No Trick Zone

Image
The popular contrarian blog No Trick Zone has made a name for itself for compiling lists of papers that are claimed to demonstrate that some aspect of climate science is all wrong. The papers in these lists generally fall into a few categories: Papers published in junk (pay-to-play) or predatory journals. Papers published in legitimate journals that don't say what NTZ claims they say. Papers published in legitimate journals that do in fact challenge some aspect of AGW. Studies show that papers in the third category total less than 1% of the recent peer-reviewed literature, so you have to wade through a ton of papers in the first two categories to find the one(s) that belong in the third. It used to be when people promoted these NTZ blogposts on social media, I'd go through the trouble of looking up the papers to confirm that the general principle I describe above still holds true. I no longer waste my time with that (Brandolini's Law and all), but occasionally WUWT picks u...

Did Dr. Viner Predict Snow Would be a "Thing of the Past?"

Image
In March 2000, the Independent ran a story by Charles Onians with the title, "Snowfalls are now just a thing of the past." The article begins by noting trends over the last 30 years for UK winters. "The first two months of 2000 were virtually free of significant snowfall in much of lowland  Britain, and December brought only moderate snowfall in the South-east. It is the continuation of a trend that has been increasingly visible in the past 15 years: in the south of England, for instance, from 1970 to 1995 snow and sleet fell for an average of 3.7 days, while from 1988 to 1995 the average was 0.7 days. London's last substantial snowfall was in February 1991." The overall point of the story is that snow frequency has been decreasing in the UK. However, Onians reported some content from Dr. David Viner, a scientist with CRU at the University of East Anglia. It reads like it was taken from an interview, with some statements coming from Onians summarizing the interv...

Can Geothermal Heat or Volcanoes Explain Current Warming?

Image
Map of Geothermal Heat Flux from Davies 2010 Sometimes I here people make claims that the globe is warming because of some aspect of the Earth's geology from the Earths' core or mantle, such as increase in geothermal heat from the Earth's interior or an increase in atmospheric CO2 coming from volcanic activity. Geothermal Heat Flux Estimates for the surface heat flow from the Earth's interior is pretty well constrained. Two recent estimates I've seen are 46 ± 3 TW[1] and 47 ± 2 TW[2]. This would count any geothermal heat from the Earths' interior, including volcanic activity, ocean ridges, subduction zones, etc. With this figure we can account for how much geothermal heat contributes to the Earth's surface temperature. Since the Earth has a surface area of 5.1*10^14 m^2, the surface heat flux from the Earth's interior is Fi = 0.09 W/m^2. The total surface heat flux is determined by the Earths' surface temperature, and if we use a standard estimate of...

Calculating Sensitivity from the LGM

Image
Despite the common misconception that estimates for equilibrium climate sensitivity (ECS) are only derived from model simulations (sometimes erroneously said to be model inputs), there are many ways to estimate ECS. Here on this blog, I've used the energy balance equation with empirical data, and despite varying levels of complexity in quantifying forcings, I keep coming up with a value for ECS of ~3.2°C for 2xCO2 . I consider these back-of-the-envelope calculations, fitting for a blogpost to show IPCC estimates are plausible and realistic, but not really for much else. All these types of equations cover a relatively short time period (~175 years) and can be significantly impacted by the uncertainties in the relevant forcings, most importantly aerosols. Some recent evidence suggests that scientists may be underestimating the cooling effect of aerosol pollution and thus underestimating ECS. In fact, Hansen published a paper recently suggesting that ECS could be as high as 4.8°C.[1] ...

Are We Still Coming Out of the Little Ice Age?

Image
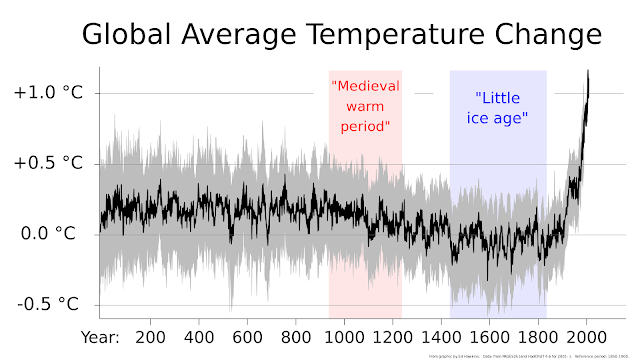
Once common refrain I hear among contrarians is that current warming shouldn't be considered exceptional or caused human activity because we're just "coming out of the Little Ice Age." The problem with this can be seen immediately by looking at the Pages2K reconstruction of global temperatures. There was likely a cooling of global temperatures that led to the LIA, normally thought to be from 1450-1850. All treatments of the LIA that I'm aware of place the end of the LIA at 1850. So since 1850 it's more accurate to say that we came out of the LIA in 1850, not that we're coming out of the LIA in 2024. Beyond this, the years between 1850 and 1900 were essentially flat. I calculated the trend with uncertainty for the three GMST datasets for 1850-1900: HadCRUT5:           -0.012 ± 0.023°C/decade (2σ) Berkeley Earth:     0.011 ± 0.028°C/decade (2σ) NOAA:                      -0.006 ± 0.019°C/de...

2023 Global Mean Surface Temperatures

Image
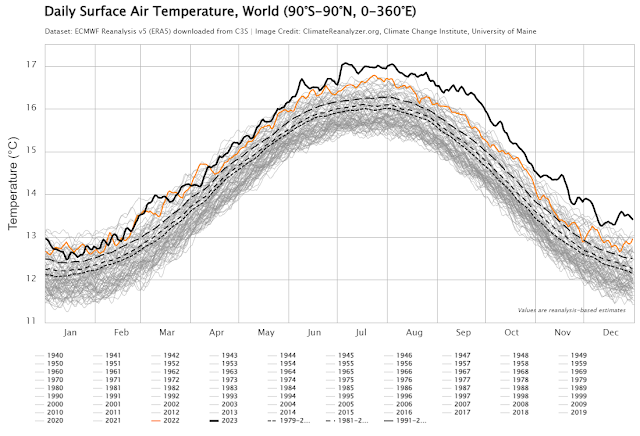
Most of the GMST temperature data is in for 2023, and it was a doozy. Around June 1, GMST headed into unchartered territory, and they stayed there for the rest of the year, with only a few days not record temperatures for the instrumental record. Now with the the availability of daily reanalysis data, it's been possible to track this on a near daily basis.  ClimateReanalyzer data for 2023 from ERA5 At the end of 2022, even with the likelihood that El Niño conditions would develop, most thought that there would be a low probability that 2023 would be a record year, beating 2016/2020, as you can see from this graph by Zeke Hausfather. 2023 came in significantly warmer than the range expected at the beginning of the year. When large El Niños developed in 1997 and 2015, it was the following year that became record years, and there's good reason to think this pattern would continue, though since scientists don't know exactly why 2023 was so warm, we should perhaps take that expe...

Contrarian Manipulation of Paleoclimate Data

Image
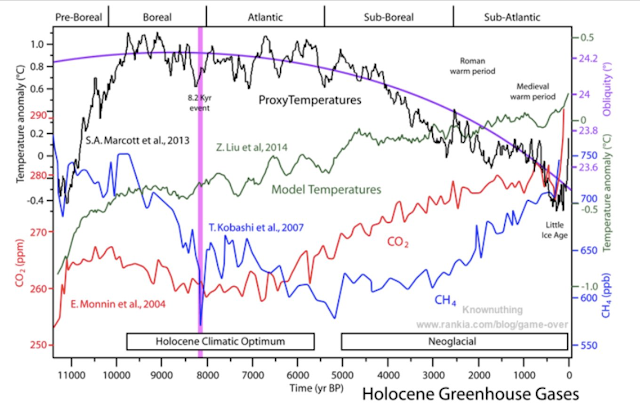
  Now that 2023 is in the books, it's pretty clear that all global temperature datasets will show 2023 to be the warmest year on record by a significant margin. And since 21st century has exceeded the warmest temperatures of the Holocene (the current interglacial), it's also fair to say that 2023 has likely been the warmest year at least since the last interglacial ended 125K years ago. I'm going to wait until all the major datasets are updated to 2023 before saying more about 2023, but Patrick Moore posted a tweet with the above graph and this: The claim is being made that “2023 was the hottest year in 125,000 years”. This is an outright lie. The Holocene Climatic Optimum from about 10,000-5,000 years ago, when the Sahara was green, was warmer than this Modern Warm Period. If the graph is intended to demonstrate that 2023 isn't the warmest of the Holocene, it fails. In fact, the graph is a convoluted mess. The CH4 time series is attributed to Kobashi et al 2007, but i...