Posts

Showing posts from May, 2022

Why Short-Term Trends are Misleading

Image
In a recent post by Willis Eschenbach[1] at the Watts Up With That blog, we are again being told that there has been a recent decline in global temperatures. The argument was that a breakpoint analysis of multiple datasets reveals a break around 2015, and trends following that breakpoint are either flat or cooling. Yet it's completely unsurprising that such a breakpoint was found in 2015, since that was the beginning of a very large El Nino, and we haven't had a significant El Nino since. Instead, La Nina conditions have prevailed. Yet, the following is indisputable from the GMST data we have: 1. El Nino years are warming at about the same rate as La Nina years (both are warming at 0.2 C/decade since 1980). 2. El Nino years average almost 0.2 C warmer than La Nina years (the difference in the Y direction between the red and blue lines above). 3. The AGW warming signal is about 0.2 C/decade since 1980. 4. ENSO cycles between El Nino and La Nina inside of decadal time scales. Tha...

Trends in the Earth's Energy Imbalance

Image
  A study was published last year that used two independent methods to estimate the rate at which the Earth's Energy Imbalance is increasing between mid-2005 and mid-2019. The first method used in situ measurements to calculate the planetary heat uptake. This method found the trend for 0–2,000 m ocean heat content anomaly to be 0.43 ± 0.40 W/m^2/decade. The second method used satellite measurements to calculate a CERES TOA energy flux of 0.50 ± 0.47 W/m^2/decade. These two trends were statistically identical to each other - the difference between them was 0.068 ± 0.29 W/m^2/decade.  The average value for EEI for the entire study period was 0.77 ± 0.06 W/m^2. In a previous post , I used three different estimates for EEI, this paper, one from Hansen (2005-2010) and one from von Schuckmann (2011-2018). I plotted all three of these values in the center year for the estimate in yellow as "studies."  In the above graph, I plotted the values for CERES and in situ measurements as...

Estimating TCR and ECS from the Logarithmic Relationship Between CO2 and GMST

Image
In a previous post , I calculated ECS (accounting for increases in GHGs and aerosols) to be about 3.3 C.  The calculation was based on CO2 causing 2.11 W/m^2 increase in radiative forcing with a total increase, after accounting for GHGs other than CO2 and aerosols, of 2.17 W/m^2 (aerosols cancel out most of the effects of GHGs outside of CO2). One weakness of that approach is that it used a value for EEI that was an average for 2011-2018 with forcings that were current through 2020. I've been thinking about a way to improve this, and here's what I came up with. Transient Climate Response (TCR) Since the relationship between CO2 and temperature is logarithmic, I decided to plot the relationship between temperature and ln(rCO2) to see what that might be able to tell us about sensitivity from empirical data. So in the above graph, on the y-axis I plotted GMST from HadCRUT5 using a 1850-1900 baseline to match the IPCC's approximation of preindustrial levels. On the x-axis, I pl...

How Do Cumulative Carbon Emissions Affect Warming?

Image
The IPCC (and others) have observed that there has been a near linear increase in GMST with cumulative anthropogenic carbon emissions. "In the literature, units of °C per 1000 PgC (petagrams of carbon) are used, and the AR6 reports the TCRE likely range as 1.0°C to 2.3°C per 1000 PgC in the underlying report, with a best estimate of 1.65°C."[1] To be clear, 1000 PgC = 1000 GtC = 1 TtC.  I decided to see if that has been observed in the empirical data. I took values from the 2021 global carbon budget [2] and HadCRUT5 set to a 1850-1900 baseline and plotted the relationship. The R^2 was 0.88, and the slope of the best fit line was 1.847 ± 0.104°C/TtC (2σ). So the 95% likely range is between 1.74 to 1.95 C/TtC from 1850-2021. If I start after we reach 200 GtC in 1951, the best fit line is 2.153 ± 0.176°C/TtC (2σ) and the R^2 increases to 0.90, but I think it's best to be conservative here. What this suggests to me is that the IPCC may again be a bit conservative their best e...

How has Extreme Heat been Affected by Climate Change?

Image
Back in 2012, Hansen published a paper[1] showing the impact of global warming on temperature extremes. He plotted the summer climatology of the NH land temperatures for the 1951-1980 mean as a probability distribution, then showed how the the bell curve has changed with global warming. He showed a similar analysis of winter temperatures in the SH. What it demonstrated was that what was considered "extreme" summer heat in the base period covered far more of the globe in 2000-2010 than it did during the base period. In effect, what would count as a 3σ summer covered ~0.1% of land surface in 1951-1980, but by 2001-2010 this same weather would cover ~10% of the globe. Hansen concludes, It follows that we can state, with a high degree of confidence, that extreme anomalies such as those in Texas and Oklahoma in 2011 and Moscow in 2010 were a consequence of global warming because their likelihood in the absence of global warming was exceedingly small. In effect, Hansen is saying th...

Steven Koonin's Misuse of the Berner 2001 Geocarb III Model

Image
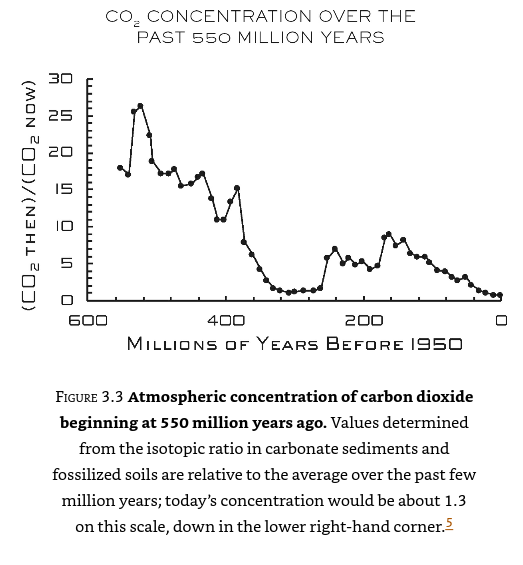
Figure 3.3 from Steven Koonin, Unsettled A recent book by Steven Koonin called Unsettled: What Climate Science Tells Us, What It Doesn't, and Why It Matters attempts to show us that much of climate science isn't really settled at all, despite political claims to the contrary. On of the chief targets of his criticism is the use of models in climate science, and he argues that the predictions of these models are not being seen in empirical data, so we should not put much stock in what they say. Now before I continue, I want to acknowledge a couple things. First, the introductory chapters on how climate change happens as a result of changing greenhouse gas concentrations is quite good. I was actually particularly impressed with it, not just because it's accurate but because he offers some very helpful illustrations of how the science works that can be helpful for those just learning the science. Second, Koonin acknowledges that his evaluation of climate science is a bit one-s...