How Feedbacks Amplify Global Warming
In a previous post (see that post for the cited literature), I calculated ECS from data provided in the Indicators of Global Climate Change for 2025 (IGCC25). I made 4 calculations using ΔT from two different baselines (1850-1900 and 1790-1839) and two different means for current temperature (the last 4 years and the last 12 years). I’d like to share again the calculations using a 1850-1900 baseline so I can illustrate how feedbacks amplify a warming signal. Here are the calculations in table form:
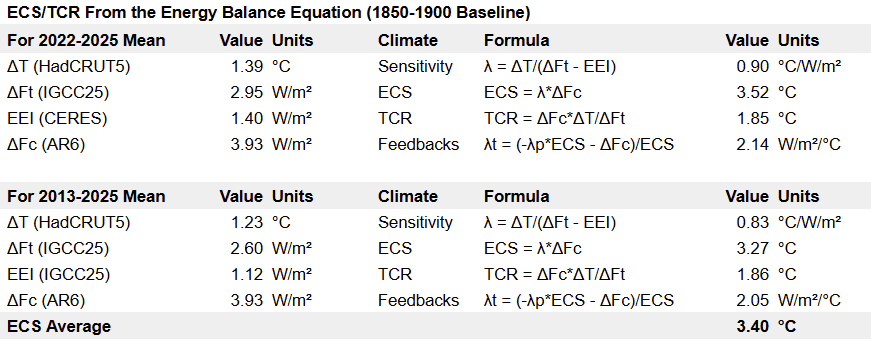
Where ΔFt is total forcings since 1850 and ΔFc is the forcing for doubling CO2. Using these values and the Energy Balance Equation and averaging the two results, we come up with an ECS of 3.4°C. Notice here that to calculate ECS we didn’t have to quantify any feedbacks. We do know that there must be positive feedbacks because Planck sensitivity (Sp) is only about 1.2°C, and we’ve already seen that much warming with just over a 50% increase in CO₂. But the Planck Feedback (λp) is important here, and we can calculate it (when T = 288 K) as:
λp = -0.4*4σT³ = -3.25 W/m²/°C
With no other feedbacks (no energy looped back into the system), 2xCO₂ would lead to an increase of ΔFc/λp =3.93/3.25 = 1.21°C warming, and we’ve already exceeded that. However, we can estimate the size of the sum of these feedbacks without knowing the value of any of the individual one. Since we calculated ECS = 3.4°C, we can first multiply ECS by Planck feedback:
-λp*ECS = 3.25*3.40 = -11.05 W/m²
If we subtract ΔFc from λp*ECS then total forcings from other feedbacks are 11.05 - 3.93 = 7.12 W/m², and that means the total feedback (outside of the Planck Response) is:
λt = 7.12/3.40 = 2.09 W/m²/°C
That is, 2.09 W/m²/°C gets looped back into the system in response to an initial forcing. This is the energy needed to close the 11.05 W/m² gap created by an initial forcing of 3.93 W/m². But how does this λt value compare to estimates of individual feedbacks? Here is an accounting of the dominant feedbacks in the climate system. Notice that the sum of these is very similar to what we calculated above:
With estimates for ΔFc, λp and λt we have another way to calculate ECS to confirm my calculation above. First, we calculate the total feedback with the Planck Response and then divide ΔFc by the sum:
This value agrees fairly well with my initial calculation above, and it’s confirming evidence that indicates that an ECS near 3°C. Whether we start with ΔF, ΔT and EEI or start with ΔFc and λpt, we get similar answers. Of course, it could be that the above feedbacks are estimated improperly. It may also be that there our estimates for ΔF, ΔT and EEI are off. But it seems less likely that there are large errors in both that would also cause us to come to similar results for ECS.
The way we often talk about feedbacks is as an amplification of a warming signal - we say that 2xCO₂ would cause a 1.21°C warming signal, but that gets amplified to 3.36°C (or 3.36/1.21 = 2.78x). This type of language is better described as gain, but we can do our calculations a little differently to describe this same effect. Let’s define gain (G) as 1/(1-f) where f is the feedback factor, and f = -λt/λp. Notice this is a unitless value, and as f approaches 1 (as λt approaches -λp), G explodes. But the calculation gives us the same result:
This means that total feedbacks amplify Planck Sensitivity (Sp) by 2.78x. We calculated Sp earlier to be 1.21°C, so we can calculate ECS to be:
ECS = Sp*G = 1.21*2.78 = 3.36°C
Doing the calculation this way can help us learn some things about the uncertainties for ECS calculations, since the equation tells us that G explodes as λt gets larger and closer to λp, and this explains why the uncertainty ranges for ECS are larger above the central estimate than below it. You can see this in the plot of G(f) below:
.png)
The IPCC’s central estimate for ECS is 3°C with a likely range of 2.5°C to 4°C. The range is 2x larger above the central estimate than below it. This is because G is a curve that is somewhat flat when f is very small or negative, but it explodes as f gets closer to 1, meaning that adding positive feedbacks multiplies Sp by larger and larger values, so uncertainties with positive feedbacks make ECS values higher than the central estimate more likely. That is, with a central estimate of 3°C, ECS is more likely to be 3.5°C than it is to be 2.5°C.
Of the above feedbacks, the cloud feedback (λcl) has been the most difficult to quantify. While the best evidence we have is that it’s positive, the uncertainty range is significant at 0.43 ± 0.35 W/m²/°C (90% CI). Keeping the sum of the other feedbacks the same (λt - λcl = 1.65 W/m²/°C), the CI for λcl means that λt can range anywhere from 1.73 to 2.53 W/m²/°C, which gives us a range of f from 0.53 to 0.78, making G anywhere from 2.14x to 4.51x. So the 90% uncertainty in the cloud feedback means ECS could theoretically be anywhere from 2.58°C to 5.46°C. However, if our λcl estimate is too high, even if it turns out to be negative, this may indicate that other feedbacks are more strongly positive than estimated, since we discovered in our initial calculation that warming has occurred too rapidly for total λt to be much less than 2 W/m²/°C. Likewise, if λcl turns out to be large, it may be that other feedbacks are less strongly positive, since warming is not occurring rapidly enough for an ECS of 5.5°C to be considered plausible. We know that significant energy is being looped back into the system, making gain significant, but we don’t have evidence that this is extraordinary. This is one reason why climate scientists can more easily rule out low values of ECS than they can rule out higher values for ECS.


Comments
Post a Comment